- BY Kevin Barry BSc(Hons) MRICS
- POSTED IN Latest News
- WITH 0 COMMENTS
- PERMALINK
- STANDARD POST TYPE
The Cheapest Litre Is the One You Never Burn: The Strangford Lough Crossing as a Fuel Hedge
Diesel has hit a record £2 a litre across the UK, and the Ards Peninsula is not far behind. Nobody in Portaferry or Lecale can control the pump price. What public policy can change is how many litres a journey needs, how long it takes, and what the public purse burns to keep a ferry running. This post sets out the evidence, shows the arithmetic, and is honest about what the evidence does not yet show.
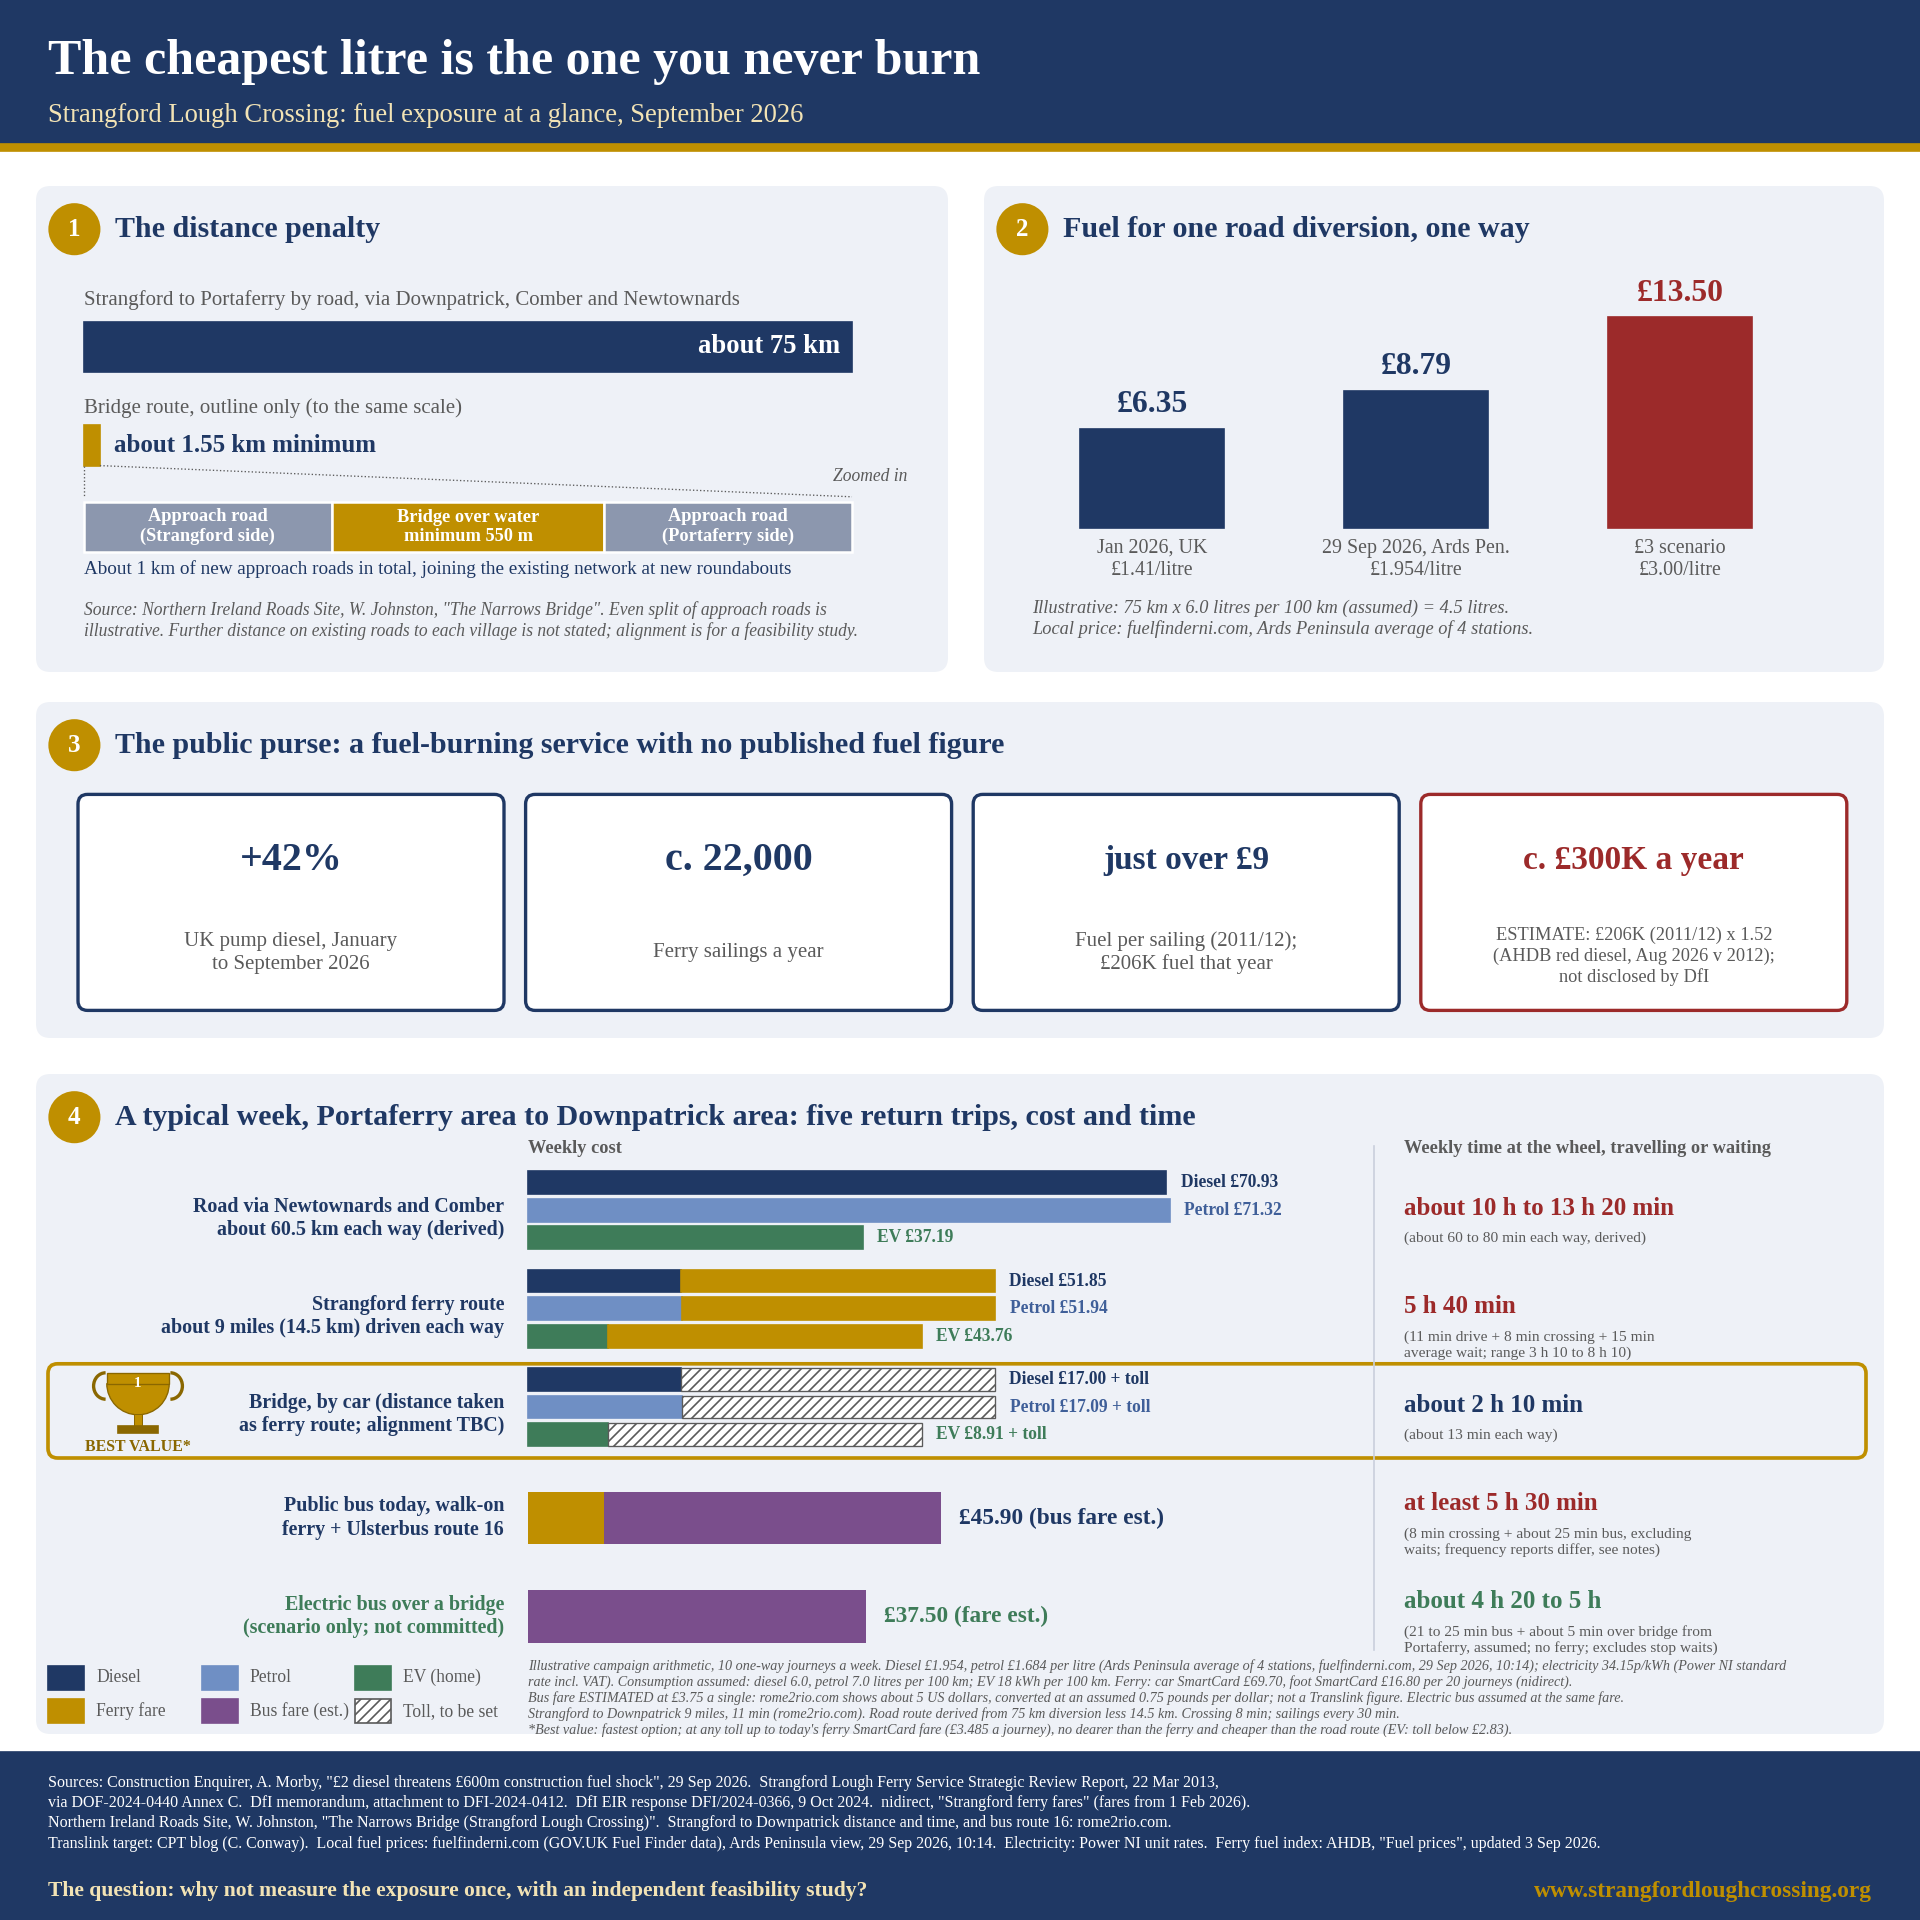
Infographic: the Strangford Lough Crossing fuel position at a glance. It shows the 75 km road diversion against a bridge route of about 1.55 km; the fuel cost of one diversion at three diesel prices; the ferry’s estimated fuel bill of about £300,000 a year; and a weekly comparison of cost and time from Portaferry to Downpatrick by road, ferry, bridge and bus, with the bridge by car marked best value.
A record price, and a warning of worse
On 29 September 2026, Construction Enquirer reported that UK diesel had reached a record £2 a litre, up from around £1.41 in January, a rise of 42% (Aaron Morby, “£2 diesel threatens £600m construction fuel shock”, Construction Enquirer, 29 September 2026).
The same report noted:
- a University of Salford supply chain specialist has urged businesses to plan for a possible £3-a-litre scenario; and
- the Construction Plant-hire Association has asked the Chancellor to extend the 5p fuel duty cut beyond December.
Northern Ireland is close behind, and the Ards Peninsula is dearer still. Both figures below are drawn from GOV.UK Fuel Finder data, via fuelfinderni.com:
- On the morning of 29 September 2026, the average diesel price across Northern Ireland was 194.0p a litre (09:32, 571 stations).
- On the Ards Peninsula, the four forecourts from Portavogie to Portaferry averaged 195.4p for diesel and 168.4p for unleaded (10:14).
There is only one reliable defence against a price you cannot control: use less of it.
Two ways to hedge fuel
In business there are two kinds of hedge:
- A financial hedge locks in tomorrow’s price today. Airlines, Ryanair among them, set out their fuel hedging positions in their annual reports. Families and small firms in Portaferry do not have that option.
- A physical hedge cuts the quantity you need. Every litre not burned is immune to any future price, whether £2 or £3.
A fixed crossing at the Strangford Narrows would be a physical hedge for road users. It would also be one for the public purse.
The evidence
1. The distance penalty
The Strangford Lough Ferry Service Strategic Review Report (Roads Service, 22 March 2013, released under FOI reference DOF-2024-0440, Annex C) records two figures:
- the road journey between Strangford and Portaferry is about 75 km and takes about an hour and a half; and
- the ferry route is about 0.6 nautical miles, with a typical crossing time of about 8 minutes.
A bridge would not simply follow the ferry route. The Northern Ireland Roads Site (Wesley Johnston, “The Narrows Bridge (Strangford Lough Crossing) County Down”) outlines:
- a bridge of at least 550 metres over water, at the narrowest point just south of Strangford; and
- about 1 km of new approach roads in total, joining the existing network at new roundabouts.
That gives a bridge route of about 1.55 km minimum, against a 75 km diversion. The final alignment is a matter for a feasibility study.
2. The diversion cost rises with every penny on the pump
The figures below are campaign arithmetic, for illustration only:
- the distance is from the 2013 Strategic Review;
- the January price is the UK figure from Construction Enquirer;
- the current price is the Ards Peninsula average from fuelfinderni.com; and
- fuel consumption of 6.0 litres per 100 km is an assumed figure.
| Item | Quantity | Unit | Rate | Total |
|---|---|---|---|---|
| Fuel, 75 km one way, January 2026 (UK) | 4.5 | litres | £1.41 | £6.35 |
| Fuel, 75 km one way, 29 September 2026 (Ards Peninsula) | 4.5 | litres | £1.954 | £8.79 |
| Fuel, 75 km one way, £3 scenario | 4.5 | litres | £3.00 | £13.50 |
3. The ferry burns fuel every day, at public expense
The published facts are these:
- DfI’s own briefing states that the ferry “operates nearly 22,000 sailings a year”, leaving each side every 30 minutes, between 07:30 and 22:45 (attachment to DfI response DFI-2024-0412, August 2024).
- The 2013 Strategic Review recorded fuel spend of £206K in 2011/12 and stated that “each sailing costs just over £9” in fuel (page 26).
- DfI’s Environmental Information Regulations response DFI/2024-0366 (Susan Anderson, Director of Finance, 9 October 2024) shows operating costs rising from £2,492K in 2016/17 to £3,520K in 2023/24, an increase of 41%.
- Against income of £1,434K, that leaves a net annual shortfall of about £2,090,000.
DfI has not disclosed the ferry’s current fuel bill. DFI/2024-0366 gives no fuel breakdown. So the campaign has estimated it from DfI’s own figures.
4. Estimating the ferry’s fuel bill
The published baseline hangs together. About 22,000 sailings at about £9 each comes to about £198K, close to the £206K recorded. The service pattern, and so the fuel volume, appears broadly unchanged since 2011/12.
The price index is the Agriculture and Horticulture Development Board’s UK red diesel series (“Fuel prices”, AHDB, updated 3 September 2026):
- 71.38 pence a litre on average in 2012; and
- 108.47 pence a litre in August 2026.
That is a factor of 1.52. This index, not pump prices, is used for the ferry, because the ferry buys fuel under a government contract rather than at the forecourt.
| Price basis | Quantity | Unit | Rate (index) | Total |
|---|---|---|---|---|
| 2011/12 actual (2013 Strategic Review) | 1 | year | 1.000 | £206.0K |
| 2025 prices | 1 | year | 1.065 | £219.4K |
| August 2026 prices | 1 | year | 1.520 | £313.0K |
On this estimate:
- the ferry’s fuel bill is now running at about £300,000 a year;
- that is roughly £94,000 a year more than at 2025 prices, carried by the taxpayer;
- fuel per sailing has risen from “just over £9” to about £13.70; and
- the increase alone is roughly one-fifth of the cost of the feasibility study the campaign is asking for.
This is an estimate, not a disclosed figure:
- The ferry’s fuel type, duty treatment and contract pricing are unpublished. The 2013 Review says only that fuel is bought “through a central government contract”.
- If the ferry pays no fuel duty, its percentage price rise would be larger than the index shows, so the estimate is more likely to be low than high.
- The campaign is seeking firm figures, and will publish them in place of the estimate once they are formally confirmed.
What it means for a typical week: Portaferry area to Downpatrick area
The figures below cover five return trips (10 one-way journeys). They are illustrative campaign arithmetic.
Prices used:
- diesel at £1.954 a litre and unleaded at £1.684 a litre (Ards Peninsula average of four forecourts, fuelfinderni.com, 29 September 2026, 10:14); and
- electricity at 34.15p per kWh (Power NI standard unit rate, including VAT).
Consumption rates assumed:
- diesel, 6.0 litres per 100 km;
- petrol, 7.0 litres per 100 km; and
- electric vehicles, 18 kWh per 100 km.
Please substitute your own vehicle’s figures.
Ferry fares are from nidirect, “Strangford ferry fares”, from 1 February 2026:
- car up to 6 metres, 20-journey SmartCard: £69.70 (£3.485 a journey); and
- adult foot passenger, 20-journey SmartCard: £16.80 (£0.84 a journey).
Weekly cost by car
| Route | Energy | Quantity | Unit | Rate | Energy cost | Fare or toll | Weekly total |
|---|---|---|---|---|---|---|---|
| Road via Newtownards and Comber (605 km) | Diesel | 36.30 | litres | £1.954 | £70.93 | none | £70.93 |
| Petrol | 42.35 | litres | £1.684 | £71.32 | none | £71.32 | |
| Electric | 108.90 | kWh | £0.3415 | £37.19 | none | £37.19 | |
| Strangford ferry route (145 km driven) | Diesel | 8.70 | litres | £1.954 | £17.00 | £34.85 | £51.85 |
| Petrol | 10.15 | litres | £1.684 | £17.09 | £34.85 | £51.94 | |
| Electric | 26.10 | kWh | £0.3415 | £8.91 | £34.85 | £43.76 | |
| Bridge (145 km; alignment to be confirmed) | Diesel | 8.70 | litres | £1.954 | £17.00 | toll not set | £17.00 plus toll |
| Petrol | 10.15 | litres | £1.684 | £17.09 | toll not set | £17.09 plus toll | |
| Electric | 26.10 | kWh | £0.3415 | £8.91 | toll not set | £8.91 plus toll |
Notes on the car figures:
- The road distance is derived. It is the 75 km diversion less the 14.5 km from Strangford to Downpatrick. The Northern Ireland Roads Site describes the diversion as running via Downpatrick, Comber and Newtownards.
- The ferry-route distance is from Rome2Rio: Strangford to Downpatrick, about 9 miles.
- Over this short trip, the ferry fare is the largest cost on the ferry route. It is two-thirds of a diesel driver’s week (£34.85 of £51.85), and about four-fifths of an electric driver’s.
Weekly cost by bus
| Item | Quantity | Unit | Rate | Total |
|---|---|---|---|---|
| Public bus today | ||||
| Ferry, adult foot passenger, SmartCard | 10 | journeys | £0.84 | £8.40 |
| Ulsterbus route 16, Strangford to Downpatrick (estimated) | 10 | journeys | £3.75 | £37.50 |
| Weekly total | £45.90 | |||
| Electric bus over a bridge (scenario only) | ||||
| Bus fare, Portaferry to Downpatrick (estimated) | 10 | journeys | £3.75 | £37.50 |
| Weekly total | £37.50 |
Notes on the bus figures:
- The £3.75 bus fare is an estimate, based on Rome2Rio’s display of about 5 US dollars converted at an assumed rate. It is not a Translink figure and will be replaced when the published fare is confirmed.
- Many passengers pay nothing. Senior 60+ SmartPass holders travel free on the ferry.
- The electric bus is a scenario, not a commitment. Translink has stated an aim of a zero-emission network across Northern Ireland by 2040, but no electric bus or bridge route has been committed for this corridor.
Weekly time
| Route | Per one-way journey | Per week |
|---|---|---|
| Road via Newtownards and Comber | about 60 to 80 min (derived) | about 10 h to 13 h 20 min |
| Ferry route, average wait | 11 min drive + 8 min crossing + 15 min wait = 34 min | 5 h 40 min |
| Ferry route, range | 19 min (no wait) to 49 min (just missed the boat) | 3 h 10 min to 8 h 10 min |
| Bridge by car | 11 min drive + about 2 min crossing = about 13 min | about 2 h 10 min |
| Public bus today | at least 8 min crossing + about 25 min bus, plus waits | at least 5 h 30 min |
| Electric bus over a bridge (scenario) | 21 to 25 min bus + about 5 min over the bridge from Portaferry | about 4 h 20 min to 5 h |
Two further constraints on the ferry:
- Operating hours. The ferry runs from 07:30 to 22:45 (DfI briefing attached to DFI-2024-0412). Anyone travelling outside those hours has only the road route.
- Weather. The Northern Ireland Roads Site notes that the ferry often does not operate in fog or strong wind. When it stops, every ferry user joins the slowest row in the table.
Sources and derivations for the times:
- The drive from Strangford to Downpatrick and route 16 bus times are from Rome2Rio.
- The road-route time is derived from published diversion figures of about 70 to 90 minutes, less 11 minutes.
- The bridge crossing of about 2 minutes, and the Portaferry approach for the electric bus, are assumptions.
🏆 Best value: the bridge, by car
On the evidence above, a bridge used by car is the best-value option:
- It is the fastest option by a clear margin, saving about 3½ hours a week against the ferry at an average wait, and 8 to 11 hours against the road route.
- At any toll up to today’s ferry SmartCard fare of £3.485 a journey, it is no dearer than the ferry for any vehicle.
- At the same toll, it is cheaper than the road route for diesel and petrol drivers. Their break-even tolls are £5.39 and £5.42 a journey.
- For electric vehicle drivers, the toll would need to be below £2.83 a journey to beat the road route on cost alone.
The award is conditional because the toll does not exist yet. Setting it is exactly the kind of question a feasibility study would answer.
What the evidence does not show
Honesty strengthens a case, so here are the limits:
- Traffic counts are not journey data. DfI’s 2023 traffic count summary records:
- 7,280 vehicles a day at CP 444, A20 Portaferry Road, Kircubbin;
- 9,100 at CP 512, A22 Comber–Killyleagh; and
- 12,670 at CP 513, A7 Belfast Road, Downpatrick at Quoile.
- Construction burns fuel too. A fuel shock raises the capital cost of any bridge. But construction fuel is a one-off, contractable cost. Ferry fuel and diversion fuel recur every day, for the life of the service.
- Electricity is not a perfect hedge. Power NI raised its residential unit price by 6.2% from 1 July 2026. Electric vehicle drivers swap diesel exposure for electricity exposure; they are not immune to energy prices.
- Pump prices move constantly. The Ards Peninsula figures are a four-forecourt snapshot taken at 10:14 on 29 September 2026, and are retained as dated screenshots.
- Several figures are estimates or assumptions, and each is labelled as such: vehicle consumption, the bus fare, the road-route distance and time, the bridge crossing time, and the ferry fuel bill.
Through the low-cost lens
A commercial operator facing a volatile input asks three questions:
- How much of it do we burn?
- What does it cost us if the price doubles?
- Can we redesign the operation to burn less?
On the public record, the Department cannot yet answer the first two for the ferry. On the third, it has declined to commission the study that would find out.
Meanwhile, the record shows:
- No appraisal of the ferry. DFI/2026-0357 (6 July 2026) confirms that the ferry was transferred internally in April 2023 with no business case, no Ministerial approval and no appraisal framework.
- No recorded consideration of a crossing. DFI/2026-0415 (5 August 2026) records “no recorded information held” on fixed crossing consideration.
- Three different cost figures, none with published workings:
- the August 2024 memorandum reached about £650 million through steps it itself calls a “guesstimate”;
- on 3 February 2026, the Minister told the Assembly the figure was “in and around £300 million and potentially more”; and
- on 11 May 2026, the Minister said “in excess of £500 million” (AQO 3527/22-27).
No low-cost operator would run a fuel-dependent service without knowing its exposure. None would dismiss a volume-reducing alternative on a guesstimate.
Conclusion for consideration
The evidence supports a clear but carefully bounded proposition. A fixed crossing is a physical hedge against fuel price volatility. It would benefit:
- every vehicle whose journey crosses the Lough, by cutting litres, hours and exposure to weather and timetables; and
- the public purse, which funds about 22,000 fuel-burning sailings a year, at an estimated fuel cost of about £300,000 and rising. And not to mention the climate benefits.
The evidence does not yet show:
- how many journeys would benefit;
- what the ferry’s true fuel bill is;
- what toll a bridge would carry; or
- whether the savings would outweigh the construction cost over the life of the asset.
Those are exactly the questions an independent feasibility study exists to answer. Its estimated cost is £250,000 to £500,000, which is between six weeks and two and a half months of the net ferry subsidy.
The question for the Minister is simple. With diesel averaging £1.95 a litre on the Ards Peninsula, £2 already breached at UK level, and £3 openly discussed, can the Department justify continuing to not measure its fuel exposure, rather than spending once to find out?
Read the evidence, check the sources, and add your voice at www.strangfordloughcrossing.org.