
- BY Kevin Barry BSc(Hons) MRICS
- POSTED IN Latest News
- WITH 0 COMMENTS
- PERMALINK
- STANDARD POST TYPE

Click on image above to open SLC – Feasibility Dashboard (Interactive)
Blog post and dashboard updated Monday 18th May 2026
Sixty Years of “Not Viable” — and the Dashboard That Asks Whether That’s Still True
Why this post, why now
For three months the Strangford Lough Crossing campaign has been making one argument, in plain language and on the record: the case for a fixed crossing at the Narrows has never been tested with the methods a modern transport appraisal would actually use. Not by anyone, not in any decade.
Today we are publishing an interactive feasibility dashboard that lets anyone — minister, MLA, councillor, peninsula resident, or sceptic — pull the levers themselves. Change the capital cost. Change the traffic forecast. Change the funding mix between Belfast, London and Dublin. Change the discount rate Treasury would apply. Watch the decision pill at the top of the screen update live.
It is not a campaign press release dressed up as a model. It is the appraisal arithmetic, exposed.
This post is the story of how we got here.
1961–1964: the bridge that was nearly built
Most people on the Ards Peninsula do not know that a fixed crossing was once an active government project. The Stormont Ministry of Commerce, Roads Division, assessed a two-lane road bridge between Strangford and Portaferry between 1961 and 1964. Funding was agreed. The files survive in PRONI — references COM/62/5/208, CAB/9B/270/3 and MOC/62/1/175 — and they are not the work of dreamers. They are engineering drawings, cost schedules and ministerial submissions.
The scheme stalled. Not for sectarian reasons, not for engineering reasons. It stalled, as one of our earlier posts set out, for the most ordinary of reasons: bad economics, risk avoidance, and the absence of anyone in the system empowered to deliver it.
That pattern would repeat for sixty years.
1997: the second study, the same verdict
In 1997 the Department of the Environment Roads Service produced “Feasibility Study — A Fixed Crossing of Strangford Lough”. It looked at multiple alignments. The direct Narrows option — Strangford to Portaferry, roughly one kilometre including approaches — was costed at £50–£70 million in 1997 prices. Brought to 2025 prices that is in the order of £108–£150 million.
The verdict was familiar: “technically feasible but not economically justified.”
What the 1997 study did not do — because the methodology of its day did not require it — was model induced demand. It treated future bridge users as essentially the current ferry users, with a modest uplift. Every comparable appraisal carried out in the UK and Ireland since has shown that this is the single most important variable in a crossing-replacement business case. Excluding it does not make the answer cautious. It makes the answer wrong.
2013–2024: the figure that wouldn’t die
The Department for Infrastructure’s position throughout the 2010s and 2020s has rested on a 2013 internal review and, more recently, a £500 million high-level cost estimate cited by the Minister in the Assembly.
That £500 million figure has now been traced. It originates in an internal departmental memorandum disclosed under Freedom of Information reference DFI-2024-0412, drafted on 7 August 2024 as a background note to assist with a correspondence response. It was not a professional engineering assessment. It was a holding line in a letter.
It has nonetheless become the number against which the scheme is publicly judged.
The 2013 review is now thirteen years old. It pre-dates the most recent guidance in the Department for Transport’s TAG (Transport Analysis Guidance, formerly WebTAG) and the 2025 HM Treasury Green Book restructure on induced demand, wider economic benefits, strategic premium, and carbon valuation. It pre-dates the Shared Island Fund. It pre-dates the Narrow Water Bridge being funded as a cross-border project. It pre-dates the Corran Narrows feasibility work commissioned by HITRANS in Scotland — the closest comparable single-vessel ferry-replacement scheme in these islands.
In short: the basis on which “not viable” continues to be said out loud is older than most of the secondary-school pupils who cross on the ferry every morning.
February 2026: “Why not?”
On 3 February 2026, in the Assembly, Infrastructure Minister Liz Kimmins MLA was asked whether a fixed crossing between Portaferry and Strangford could be progressed.
Minister Kimmins’ recorded answer was two words: “Why not?”
Minister Kimmins has since confirmed, in subsequent correspondence and in the Assembly, that a fixed crossing is a credible option, that the matter remains under review subject to budget, and that the test is “strong support and a solid economic case”. Her Department, however, has so far declined to commission even a basic, time-limited feasibility and options appraisal — despite 94% local support, despite repeated storm damage to the A20 Portaferry Road, and despite the ferry service operating at a structural loss of over £1 million per year, as documented by the operator itself.
The campaign’s position has been consistent throughout. We are not asking for a bridge to be built. We are asking for the sums to be done properly, once, with no presumption either way.
This dashboard is what those sums look like when you do them.
What the dashboard is — and what it is not
It is not a decision. It is not a business case. It is not a substitute for an Outline Business Case prepared under the Better Business Case (5-Case Model) framework adopted across NI public-sector investment appraisal in 2021, which replaced the older NIGEAE guidance and aligns NI directly with HM Treasury Green Book methodology. We say that on the screen. We say it here.
What it is is an honest, evidence-based, fully interactive appraisal model that puts the levers in the user’s hands. Every input has a footnote. Every default is anchored to a referenceable source. The central case is set deliberately at the £500 million figure the Minister cited, with every other input sitting at the upper end of the credible DfT TAG range — not pushed to its limit, but not artificially conservative either.
At those settings the central case returns a benefit-cost ratio of 2.41, a positive net present value of around £994 million over the 60-year appraisal period, and an adjusted capital cost of £625 million once optimism bias is applied. Cumulative undiscounted monetised benefits — transport user benefits, societal impacts, and carbon — first exceed the adjusted capex by the end of operating year 12. Each of the three potential funders — the Northern Ireland Executive, the UK Government, and the Irish Government via the Shared Island Fund — passes its own attributable BCR gate.
The Northern Ireland Executive’s net position over the 60-year horizon, at default settings, is a net call of approximately £162 million in present-value terms. Move the toll rate from £2 to £3.75, hold every other input constant, and that net call goes to zero. Move it to £5, with 95% paying share and the full £8 million per annum rates uplift, and the bridge becomes a net positive contributor of approximately £256 million to the NI Exchequer. The dashboard provides four one-click presets that show what combinations of toll, paying share, rates uplift, capex discipline and funding split bring the NI Executive to net break-even by year 10, 20, 40 or 60 respectively.
Those are the headlines. But they are not the point.
The point is that the user can change any of it.
- Push the capital cost to £750 million and watch the case wobble.
- Apply a Treasury 7% discount rate and see it move to marginal.
- Strip out induced demand entirely, the way the 1997 study did, and watch it fail.
- Set UK Government funding to 100% and see the funder rationality gate flag that no honest UK Treasury appraiser would write that cheque.
- Set the strategic premium to zero — the dashboard’s default — and the case still clears on transport benefits alone.
The dashboard is honest about where the case is fragile. Carbon is net-marginal at central settings, because induced traffic adds vehicle-kilometres that the diesel saved from the ferry does not fully offset. The Northern Ireland Department of Finance capital envelope is stretched, not broken, by the NI share. Four of the five non-financial strategic constraints — Special Area of Conservation and Marine Nature Reserve consent, Section 75 equality screening, operating model, reference-class risk — are open. One, Subsidy Control, is in progress, with the Narrow Water precedent in its favour.
None of that is hidden. All of it is on screen.
Every default is traceable
The dashboard contains a dedicated Methods & sources tab that lists every numerical default, its source, and the methodological limit. The £500 million capex is referenced to FOI DFI-2024-0412. The 1,100 vehicles per day ferry-recapture figure is referenced to DfI patronage statistics. The 13,000 vehicles per day induced AADT is referenced to the Corran Narrows feasibility work commissioned by HITRANS in 2023, the closest comparable Scottish scheme. The 38 kilotonnes embodied-carbon figure is derived from the Rose Fitzgerald Kennedy Bridge in Wexford — 887 metres of extradosed concrete segmental construction completed in 2020 — scaled to the Strangford Narrows by deck area and multiplied by the IStructE and National Highways benchmark of approximately 2,000 kilograms of CO₂-equivalent per square metre of deck for major concrete bridges. The Green Book central traded carbon value, applied at £290 per tonne, is referenced to the December 2024 DESNZ update. The 3.5% social discount rate is the Green Book central STPR. The toll demand elasticity of −0.3 is taken from the Mersey Gateway, M6 Toll and Severn reference class. None of these numbers is asserted from the air. Each can be challenged on the same page on which it is used.
And the gaps to a full Outline Business Case are listed openly in the same tab — no calibrated TUBA or DIADEM transport model, no quantity-surveyed cost plan, no Environmental Impact Assessment, no Habitats Regulations Assessment under the multiple Strangford Lough designations (SAC, SPA, ASSI, Ramsar and Marine Nature Reserve), no Section 75 equality screening, no fleet-decarbonisation trajectory on operational emissions, no residual asset value at year 60, no Commercial Case procurement test. The dashboard is honest about what it is. It is a screening-level argument that the Outline Business Case is worth commissioning. It is not the Outline Business Case.
If a Departmental economist objects to any specific number, the response is on the same page: yes, that is noted, with its source and its OBC requirement to refine. Are you saying the feasibility study should be commissioned to refine it?
What we are asking for
We are asking the Northern Ireland Executive, through the Department for Infrastructure, to commission a time-limited, independent feasibility and options appraisal of a fixed crossing at the Strangford Narrows. No presumption of construction. No commitment to a preferred alignment. Just the appraisal — done once, done properly, done to current standards.
The institutional mechanisms exist. The Narrow Water Bridge Oversight Board demonstrates that cross-border infrastructure co-investment between Belfast, London and Dublin is operational, funded, and underway. The Shared Island Fund has already committed €3 million to bring Narrow Water to tender stage, with construction funding to follow. The precedent is not theoretical. It is being poured in concrete.
The first step for the Strangford Narrows is a feasibility study. Nothing more.
The dashboard is, in effect, the campaign’s good-faith down payment on that work. We have done what we can do without ministerial authority and without access to the Department’s traffic models. The professional, full-scale appraisal is for DfI to commission. We have shown that the question is worth asking.
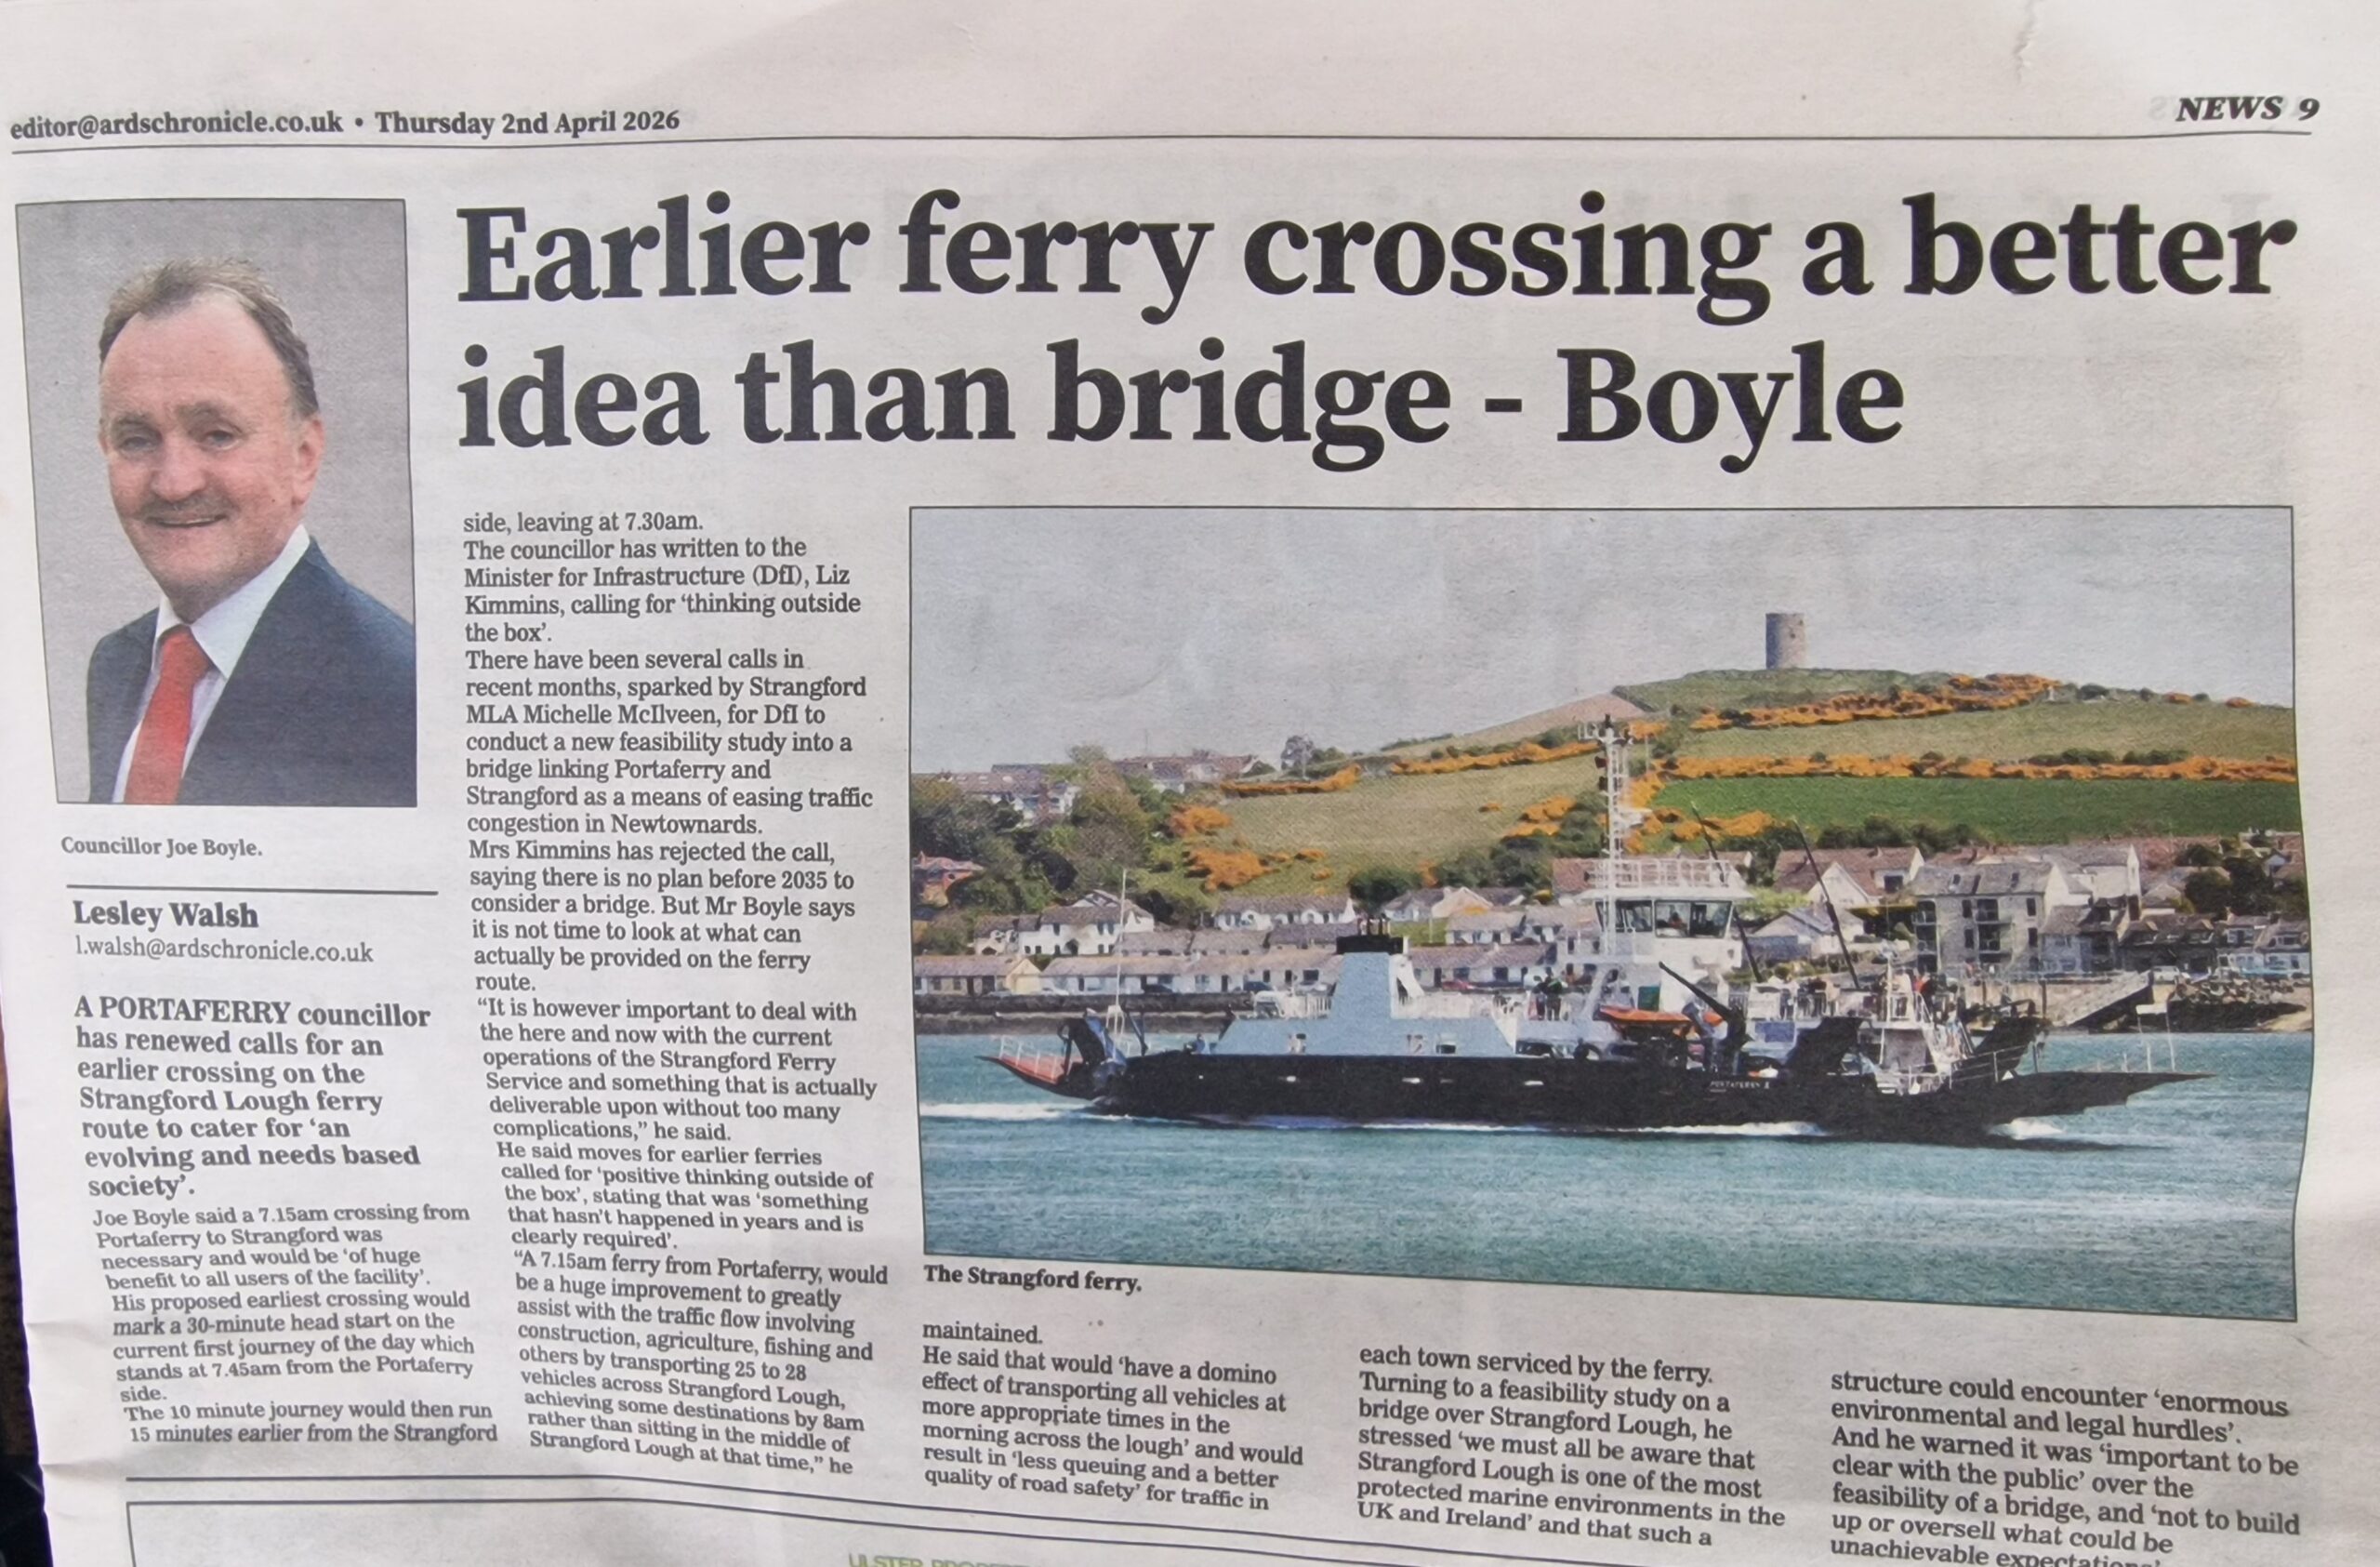
Post blog note: We were handed this local article from The Chronicle dated 2nd April 2026 and disappointed to read the heading and content.
The 7am ferry is not the answer
On 2 April 2026, the Ards Chronicle carried a piece headlined “Earlier ferry crossing a better idea than bridge — Boyle“. Portaferry councillor Joe Boyle had written to the Minister calling for the first ferry of the day to start at 7am rather than 7:30am. He described a fixed crossing as “unrealistic” within current finances, cited “enormous environmental hurdles” and “huge costs”, and called for “positive thinking” and an “evolving and needs-based society”.
I want to be fair to the councillor. A 7am ferry would be a genuine improvement for commuters. The reasoning is the kind of pragmatic, near-term thinking that a representative for a peninsula community is right to bring forward. If the choice were between an earlier ferry sailing and nothing at all, the earlier sailing wins.
But the choice on offer is not that.
The choice on offer is between a 7am ferry that saves 10 minutes for some commuters on some days, and a fixed crossing that — at the central settings in this dashboard — covers its own capital cost in operating year 12, delivers £994 million of net economic value over 60 years, ends the structural £1 million annual subsidy the ferry currently requires, removes the weather-driven cancellations that strand peninsula residents on average twice a month, and gives every secondary-school pupil on the peninsula a reliable journey to school.
To frame those two as alternatives is the folly. They are not the same kind of intervention at all. One is a timetable adjustment. The other is a generational infrastructure decision with a 120-year asset life. Choosing the timetable adjustment and calling it “thinking outside the box” is the opposite of what that phrase means. It is thinking firmly inside the box, the same box that has been thought inside since 1961.
The environmental argument deserves a direct response. Strangford Lough is a Special Area of Conservation, a Special Protection Area, an Area of Special Scientific Interest, a Ramsar wetland, and the United Kingdom’s first Marine Nature Reserve. Those designations are real and they impose a high bar. They do not, however, impose an infinite bar. The same designations were not deemed to make the Narrow Water Bridge unbuildable, and that crossing sits in a comparably sensitive estuarine context. What the designations require is a Habitats Regulations Assessment, an Environmental Impact Assessment, and a properly evidenced mitigation strategy — all of which are statutory inputs to a feasibility study. Saying “the environmental hurdles are enormous, therefore we should not commission the study that would tell us how to clear them” is not caution. It is its inverse.
The “huge costs” argument has the same shape. Yes, a fixed crossing would cost in the £350–£625 million range at the credible end of the reference class. No, that does not make it unaffordable when the Shared Island Fund has already committed to Narrow Water and the Strangford crossing carries a defensible attributable benefit-cost ratio in front of every one of the three potential funders. Calling it “unrealistic within current finances” without doing the funding-mix arithmetic is an assertion, not an analysis. The dashboard does the arithmetic. The councillor can run it himself.
This is the pattern the campaign has been warning about. Each generation is offered a small comfort instead of the structural fix. In 1969 it was a second-hand ferry from Wales. In 1997 it was a study with a conclusion already written. In 2024 it was a £500 million figure typed into a holding letter. In 2026 it is a 7am sailing. The pattern is consistent: defer the harder question by accepting the smaller answer.
The peninsula deserves better representation than that. It deserves Councillors, MLAs, MPs — and a Department — who will say, on the record: the right answer is to commission the feasibility study, accept what it says, and either build the bridge or close the conversation properly. Not perpetuate it for another decade by trading the question of the fixed crossing for the question of the breakfast sailing.
The radar chart presents all nine indicators simultaneously, making the structural imbalance immediately legible: the Ards and North Down profile collapses sharply inward on the productivity, wage, export and research-and-development axes, whilst pushing outward on entrepreneurship and household income. The accompanying reference table gives the precise figures, NI ranking and percentage deviation from the NI average for each indicator, with green denoting outperformance and red underperformance relative to the NI average.
The radar scale is normalised around the NI average (set at 50), so the shape of the blue polygon tells the story at a glance. The two standout anomalies for any ministerial audience are these: the area ranks last in NI on median wages yet second in NI on gross domestic household income per head, confirming the commuter-belt dynamic identified in the regional analysis underpinning DfE’s 2024 Sub-Regional Economic Plan; and it ranks first in NI on early-stage entrepreneurship despite ranking tenth or eleventh on the productivity and export indicators that entrepreneurship would ordinarily be expected to drive over time.
Both anomalies point to the same structural constraint: economic activity generated locally cannot scale because the infrastructure connecting the southern Ards Peninsula to wider markets is limited by a ferry timetable.
If the feasibility study comes back and says no, we will accept that. We will say it openly, and we will move on. What we will not accept is being offered a 7am ferry as the answer to a sixty-year question that has never been asked in earnest. If, after 21 years of public service, this is the height of one’s ambition for the people, then time for change. The tables and charts below explain how the Ards Peninsula has fared over the past decades.

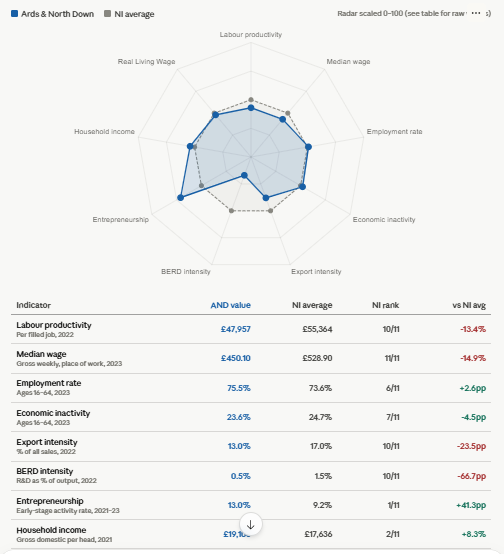
The radar chart presents eight indicators simultaneously, making the structural imbalance immediately legible: the Ards and North Down profile collapses sharply inward on the productivity, wage, export and research-and-development axes, whilst pushing outward on entrepreneurship and household income. The accompanying reference table gives the precise figures, NI ranking and percentage deviation from the NI average for each indicator, with green denoting outperformance and red underperformance relative to the NI average.
The radar scale is normalised around the NI average (set at 50), so the shape of the blue polygon tells the story at a glance. The two standout anomalies for any ministerial audience are these: the area ranks last in NI on median wages yet second in NI on gross domestic household income per head, confirming the commuter-belt dynamic identified in the Sub-Regional Economic Plan Technical Annex (October 2024); and it ranks first in NI on early-stage entrepreneurship despite ranking tenth or eleventh on the productivity and export indicators that entrepreneurship would ordinarily be expected to drive over time.
Both anomalies point to the same structural constraint: economic activity generated locally cannot scale because the infrastructure connecting the southern Ards Peninsula to wider markets is limited by a ferry timetable.
Try it yourself
The dashboard runs in any modern browser. There is nothing to install, no account to create, and no data to submit. Every input is yours to change, every output updates live, and the rationale panel beneath the headline explains, in plain English, which of your inputs is driving the result.
Open the SLC Feasibility Dashboard →
If you reach a different answer to ours by moving the levers honestly, we want to hear from you. If you reach the same answer, we want to hear from you too — because the more people who have run those numbers themselves, the harder it becomes to keep saying “not viable” without saying which input, at which value, makes it so.
For sixty years the Strangford Narrows has been told the sums do not add up. For the first time, you can do the sums yourself.
Kevin Barry BSc(Hons) MRICS, Quintin QS, Belfast. This dashboard is a campaign tool, not a statutory appraisal. It does not represent the position of the Department for Infrastructure, the Northern Ireland Executive, the UK Government or the Government of Ireland. All inputs and assumptions are sourced.
Case Studies: Both Sides of the Water
Cleddau Bridge, Wales — The Most Direct Comparator to Strangford
Opened: March 1975, replacing a vehicle ferry between Neyland and Pembroke Dock. The two banks were less than 1 mile apart across the water but 28 miles (45 km) by road — almost identical geometry to the Strangford / Portaferry problem.
| Metric | Ferry (pre-1975) | Bridge Year 1 | Bridge 2024 |
|---|---|---|---|
| Annual crossings | ~200,000 (est.) | 885,900 | ~4,745,000 |
| Growth factor | — | ~4–5× | ~20× |
The growth was not simply diverted ferry traffic. The bridge unlocked economic development, residential expansion, and travel that simply had not happened before. Even toll removal in 2019 — which the Welsh Government funded at £3 million per year — was justified on the basis of accelerating further economic growth in Pembrokeshire on both sides of the estuary. (Sources: Wikipedia — Cleddau Bridge; Welsh Government.)
The same ferry that served the Cleddau crossing — the Cleddau King — was sold and repurposed as the Portaferry–Strangford reserve vessel. In 49 years the Cleddau Bridge accumulated 137.9 million crossings; the Strangford Ferry achieved 11.6 million — a factor of 12× difference attributable almost entirely to the ferry’s artificial constraint on demand. (Source: Quintin QS comprehensive analysis.)
Forth Road Bridge, Scotland — Ferry to Arterial Spine
Opened: 4 September 1964, replacing a centuries-old Queensferry ferry service (which by the 1950s was making 40,000 crossings annually, carrying 800,000 vehicles).
| Metric | Pre-bridge | Year 1 | Peak |
|---|---|---|---|
| Annual crossings | ~800,000 vehicles | ~2.5 million | ~21.4 million (2008) |
The bridge carried its 250 millionth vehicle in 2002 — just 38 years after opening. Traffic growth so far exceeded design assumptions (30,000 vehicles/day was the projection; the bridge regularly carried 65,000+) that a second crossing, the Queensferry Crossing, had to be built and opened in 2017. Fife was economically transformed: businesses expanded, residential patterns shifted across the Forth, and Edinburgh’s labour catchment grew north into the kingdom. (Sources: Forth Road Bridge, Wikipedia; Transport Scotland.)
Øresund Bridge, Denmark–Sweden — Cross-Border Labour Market Integration
Opened: July 2000, linking Copenhagen to Malmö (16 km combined bridge-tunnel, rail + road). Three ferry routes between southern Sweden and Copenhagen were simultaneously withdrawn.
| Metric | Pre-2000 | 2022–2024 |
|---|---|---|
| Cross-border commuters (Sweden→Denmark) | ~100s | 18,400+ (rising) |
| Consumer surplus generated 2000–2010 | — | €2 billion |
| Benefit-cost ratio (50-year horizon) | — | 2.2 |
The transformation was not just in traffic numbers — it was in the structure of two regional economies. Malmö’s housing market boomed as Swedish residents could access Copenhagen wages while paying Swedish house prices. The Øresund region became Northern Europe’s largest integrated labour market, with 4 million inhabitants within effective commuting reach of each other. The OECD found that labour market integration increased sharply post-2000, driven by salary differentials and housing arbitrage that the bridge made exploitable. (Sources: ScienceDirect ex-post CBA; ifo/CESifo regional study; Nordic Labour Market data.)
Confederation Bridge, Prince Edward Island, Canada — Island Transformation
Opened: May 1997, replacing ferry service as the sole crossing to the Canadian mainland (12.9 km — the longest bridge over ice-covered water in the world).
| Metric | 1996 (pre-bridge) | Post-bridge change |
|---|---|---|
| Annual tourists | 740,000 | 1,200,000 in Year 1 (later stabilised ~900,000) |
| PEI unemployment | 16.4% (May 1997) | 10.3% (April 2017) |
| Monthly GDP (exports) | ~$120m | ~$202m (March 2017) |
| Daily vehicle crossings | (ferry-limited) | ~4,000 / day pre-COVID |
The bridge did not simply speed up the existing ferry journey — it restructured the island’s economy, reduced unemployment by one-third, and enabled PEI businesses to operate as part of the mainland economy rather than as an island dependency. Tourism jumped 62% in Year 1 alone. (Sources: CBC — Then and Now; Business in Focus.)
Millau Viaduct, France — Traffic Diversion and Urban Relief
Opened: December 2004, carrying the A75 motorway across the Tarn valley, bypassing the town of Millau.
The bridge did not connect a new pair of communities — it diverted existing through-traffic. The effect on the town was initially feared to be catastrophic (tourists would bypass the valley entirely) but proved complex:
- Millau was relieved of 3–4 hour summer traffic jams that had damaged its image and economy for decades.
- A “viaduct effect” drew tourism specifically to see the bridge — 500,000 visitors to the bridge’s visitor centre in 2005 alone; Roquefort cave visits nearly doubled to 410,000 in 2005.
- Long-haul freight trucks re-routed from Lyon, saving over 60 km per journey and cutting approximately 40,000 tonnes of CO₂ per year from HGV traffic alone.
- The bridge has already paid back its construction carbon within 20 years through fuel and distance savings.
The lesson for through-traffic corridors: diversion infrastructure reshapes economic geography on both sides even when it bypasses rather than connects. (Sources: Le Monde; Energy in Demand.)
Jiaozhou Bay Bridge, China — Logistics Integration
Opened: June 2011, at 42.5 km the world’s longest sea-crossing bridge (by total length), connecting Qingdao to Huangdao district.
The bridge cut travel time between the two by approximately 30 minutes, directly integrating port infrastructure, highways, and industrial zones along the bay’s coastal axis. Six lanes were provided to absorb high commercial volumes. The effect was primarily logistical — reducing transport costs, increasing route predictability for freight, and knitting together Shandong Province’s industrial corridor. (Source: CRECG.)
London Bridge — The Historical Archetype
The GLA’s working paper on bridge economics traces the pattern back to 1209, when the new stone London Bridge transformed Southwark from a marginal suburb into a prosperous commercial district. Shops built on the bridge itself created a fashionable retail connection; Southwark “prospered and expanded.” The same paper documents how the 1416 Abingdon bridge destroyed the market at Wallingford by diverting the Gloucestershire road — an early example of how a new crossing reshapes both sides simultaneously, creating winners and losers. (Source: GLA Working Paper 32.)
Common Themes Across All Cases
| Pattern | Evidence |
|---|---|
| Traffic far exceeds forecasts | Forth (2× design), Øresund (5× initial projections by year 5), Confederation, Cleddau |
| Suppressed demand is released immediately | Cleddau 885,900 crossings in Year 1; PEI tourism +62% in Year 1 |
| Both sides benefit asymmetrically | Øresund: Malmö housing boom, Copenhagen labour market; PEI: tourism inflow + export growth |
| Ferry removal is not a loss — it is a constraint removed | Every case shows ferry traffic was artificially suppressed, not indicative of true demand |
| Economic development follows access | Employment, housing, business investment follow within 5–10 years of opening |
| Tourism is amplified on peninsula / island sides | PEI, Millau, Confederation, Cleddau all recorded sharp tourism uplift on the previously constrained side |
| Infrastructure creates its own demand case | The Narrow Water Bridge’s success will directly expose Strangford as the next bottleneck on the east coast corridor |
Relevance to Strangford Lough Crossing
The 83% avoidance rate on the Strangford ferry — where 29,000 vehicles are recorded travelling around the surrounding roads daily at 3 key cumlative points; a significant % of these vehicles would consider crossing at Portaferry/Strangford but avoid so, while only ~650 can actually use the ferry — is the textbook signature of suppressed demand. Every case study above began from the same position: a constrained crossing with low measured usage that was subsequently revealed to represent a fraction of latent demand. The Cleddau precedent — same geometry, same ferry-to-bridge transition, same suppressed demand dynamic — shows what a 49-year trajectory actually looks like when the constraint is removed: a 20× increase, not a modest increment.