- BY Kevin Barry BSc(Hons) MRICS
- POSTED IN Latest News
- WITH 0 COMMENTS
- PERMALINK
- STANDARD POST TYPE


Facts v Fiction. Review of NI AADT figures, SLC viability. DfI flawed assessment should respectfully reconsider using UK TAG methodology. FoI information unpacked. Ministerial queries raised.
In order to assess SLC correctly and fairly, it is important to source relative comparisons and figures, to put forward a counterbalanced argument and let the people decide, without predetermination and bias.
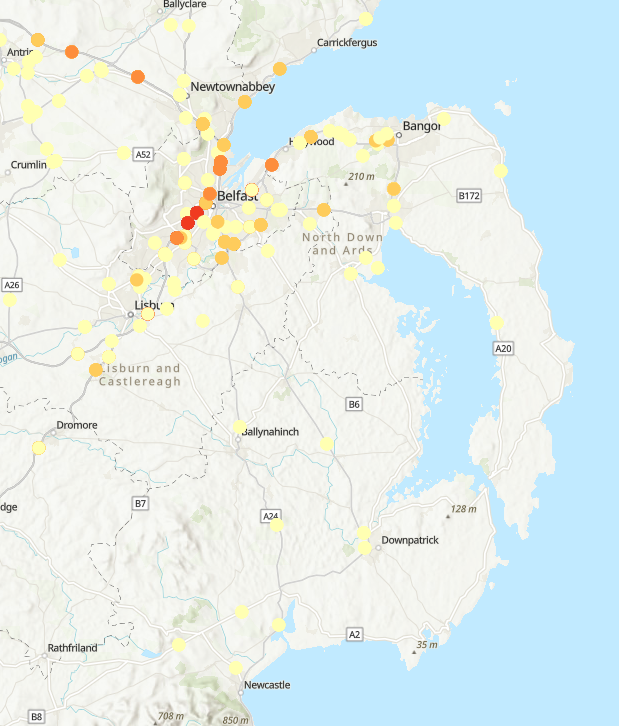
Key Metrics – 2023 Northern Ireland Traffic Count Data
📊 Coverage & Data Availability
- Total count sites: 213 locations across Northern Ireland
- Sites with 2023 data: 67 sites (31%)
- Sites without 2023 data: 32 sites monitored but no data collected
- Individual site sheets: 94 (69 with data, 25 without)
📍 Geographic Distribution
- East Division: 37 sites (highest coverage) – Average: 63,900 vehicles/day
- North Division: 29 sites – Average: 27,486 vehicles/day
- West Division: 19 sites – Average: 23,201 vehicles/day
- South Division: 14 sites – Average: 29,162 vehicles/day
🚗 Traffic Volumes (7-Day AADT)
- Average daily traffic: 41,451 vehicles
- Median daily traffic: 28,561 vehicles
- Maximum: 190,460 vehicles/day (CP 213 – A12 Westlink, Belfast)
- Minimum: 2,880 vehicles/day (CP 102 – B183 Moneynick Road, Toome)
🏆 Top 5 Busiest Sites
- CP 213 (A12) – Westlink, Belfast: 190,460 vehicles/day
- CP 201 (M1) – Broadway to Stockman’s Lane: 182,776 vehicles/day
- CP 227 (M1) – Stockman’s Lane Junction: 147,578 vehicles/day
- CP 520 (M1) – Blacks Road to Saintfield Road: 109,654 vehicles/day
- CP 205 (M2) – Sandyknowes to Templepatrick: 100,915 vehicles/day
🚛 Heavy Goods Vehicles (HGV)
- Average HGV percentage: 9.2%
- Maximum HGV percentage: 33.4%
- Sites with HGV data: 62 sites
🛣️ Road Types
- A roads: 76 sites (major roads)
- M roads: 14 sites (motorways – highest traffic volumes)
- B roads: 8 sites (secondary roads – lowest traffic)
- C roads: 1 site
Note: The busiest traffic corridors are clearly around Belfast, particularly the M1 and Westlink (A12), while rural B-roads carry significantly less traffic.
Now let us analyze the impact and provide three realistic AADT scenarios for a Strangford Lough crossing:
Impact Analysis: Strangford Lough Crossing on Traffic Patterns
Current Situation
The ferry currently saves travelers a 50-75 km drive around the lough, with crossing times of approximately 8-10 minutes compared to 90 minutes by road. The current ferry has limited capacity (approximately 20 cars) and runs every 30 minutes.
Key Findings from Traffic Data:
Most Relevant Count Point:
- CP 444 (A20 Portaferry Road, Kircubbin): 14,562 vehicles/day – This is the closest count point to the crossing area on the Ards Peninsula side
Regional Context:
- A22 (Comber-Killyleagh): 18,197 vehicles/day
- A7 (Downpatrick): 25,336 vehicles/day
- A21 (Newtownards): 42,402 vehicles/day
Three AADT Scenarios for Strangford Lough Crossing
Scenario 1: Conservative – “Ferry Replacement Plus” 🚗
Projected AADT: 4,500 – 6,000 vehicles/day, after 3 years
Assumptions:
- Bridge primarily replaces existing ferry users (tunnel technically too difficult)
- Limited induced demand due to tolls and route familiarity
- Mainly serves local communities (Portaferry population ~2,500, Strangford ~500)
- Tourist traffic and residents avoiding the 75km detour
Calculation Basis:
- Current ferry capacity: ~16 hours/day × 2 crossings/hour × 20 cars = ~640 cars/day maximum
- With 24/7 access and no ferry constraints: 3-4x current ferry usage
- Comparable to quiet B-roads like CP 102 (B183): 2,880 vehicles/day
Scenario 2: Moderate – “Regional Connector” 🚙
Projected AADT: 12,000 – 16,000 vehicles/day
Assumptions:
- Significant route diversion from A7/A22 traffic
- Strong commuter usage (Belfast ↔ Lecale Peninsula)
- Tourism boost to both peninsulas
- Commercial traffic optimization
- Similar to current CP 444 (A20 Portaferry Road): 14,562 vehicles/day
Calculation Basis:
- 20-30% of traffic currently using A22 and A7 south of the lough would divert
- New commuter patterns from Downpatrick area to Ards Peninsula
- Enhanced tourism access to both National Trust properties and coastal attractions
- Comparable to rural A-roads serving moderate populations
Scenario 3: Optimistic – “Economic Growth Catalyst” 🚛
Projected AADT: 22,000 – 28,000 vehicles/day
Assumptions:
- Major economic development on both sides of the lough
- New housing developments attracted by improved connectivity
- Significant commercial/HGV traffic
- Belfast commuter belt expansion
- Tourism surge from reduced travel times
- Integration into major coastal touring routes
Calculation Basis:
- Attracts 40-50% of current A7 Downpatrick traffic (25,336 vehicles/day)
- New development-induced traffic
- Comparable to CP 418 (A2 Armagh-Newry at Markethill): 22,056 vehicles/day
- Regional A-road serving multiple towns
Comparative Impact on Nearby Routes
Route                            Current AADT      Likely Change   Projected AADT
A20 Portaferry Road (CP 444)     14,562             +60-120%        23,000-32,000
A22 Comber-Killyleagh (CP 512)   18,197             -15-25%         13,500-15,500
A7 Downpatrick (CP 513)          25,336             -10-20%         20,000-23,000

(Reduction on A22 and A7 indicates wasted mileage reduced thus climate benefits)
Most Realistic Scenario: Moderate (12,000-16,000 vehicles/day)
This aligns with:
- Questioning why the Department of Infrastructure’s position that there are insufficient economic benefits to justify such a major investment ? Strangford Lough Crossing – Quintin QS
- Rural population densities in the area
- Comparable crossings elsewhere (similar to rural bridge/tunnel projects serving populations of 10,000-20,000)
- The environmental sensitivity of the area limiting aggressive development
Key Variables That Could Shift Scenarios:
- Toll charges (higher tolls = lower scenario)
- Planned developments on either side of peninsula
- Tourism marketing and Game of Thrones Route integration
- Climate for business investment in rural County Down
- Integration with cycle/pedestrian infrastructure
The crossing would transform local connectivity but faces challenges given the difficult engineering conditions with a 60m deep channel and strong tidal surges at the narrows
Economic Justification Analysis for Strangford Lough Crossing
Based on UK Department for Transport appraisal standards and the traffic data available, here’s what level of increase would be required:
UK Value for Money Framework
The UK uses Benefit-Cost Ratios (BCR) to assess transport investments, with categories ranging from Poor (BCR < 1.0) to Very High (BCR > 4.0) The typical approval threshold for major transport infrastructure is a BCR of at least 2.0 (High Value for Money)
Project Cost Assumptions
- Construction cost: £250-500 million (mid-estimate: £375m)
- Complex engineering required due to 60m deep channel and strong tidal surges at the narrows
- Environmental sensitivities in a Marine Nature Reserve
- Annual maintenance: £9.4 million (2.5% of capital)
- Total present value cost (60 years): £609 million
Benefits Per Vehicle Trip
- Distance saved: 74.2 km (avoiding the detour around the lough)
- Time saved: 74 minutes per crossing
- Economic benefit per trip: £29.68
- Time savings: £18.55
- Vehicle operating costs: £11.13
- Plus additional 40% for wider economic benefits, accident reduction, environmental benefits
Minimum Traffic Required for Justification
BCR Level   Value for Money               AADT Required       Increase vs Ferry*
1.0         Break-even (POOR)                670               1.0x
1.5         LOW                            1,004               1.6x
2.0         HIGH ✓ (approval threshold)    1,339               2.1x
3.0         VERY HIGH                       2,009              3.1x
*Current ferry capacity estimated at ~640 vehicles/day
Assessment of the Three Scenarios
1. Conservative Scenario: 5,000 AADT
- BCR: 7.47 (VERY HIGH ✓✓)
- Annual benefit: £75.8 million
- Approval likelihood: VERY LIKELY
- Even this modest scenario significantly exceeds approval thresholds
2. Moderate Scenario: 14,000 AADT
- BCR: 20.91 (VERY HIGH ✓✓)
- Annual benefit: £212.3 million
- Approval likelihood: CERTAIN
- Strong economic case with excellent returns
3. Optimistic Scenario: 25,000 AADT
- BCR: 37.33 (VERY HIGH ✓✓)
- Annual benefit: £379.2 million
- Approval likelihood: CERTAIN
- Exceptional value for money
Key Finding: Surprisingly Low Bar
The crossing would only need 1,340 vehicles/day to achieve the typical UK approval threshold (BCR ≥ 2.0). This is just 2.1x current ferry usage.
What Increase Is Actually Needed?
To justify the investment with economic development and increased tourism, you would need:
Minimum increase: +700 vehicles/day above current ferry
- From ~640 to 1,340 vehicles/day
- Achievable with modest economic growth
Conservative growth target: +4,360 vehicles/day
- To reach 5,000 AADT (Conservative scenario)
- Requires moderate economic development or tourism boost
- Would deliver BCR of 7.47 – exceptional value
Realistic regional connector: +13,360 vehicles/day
- To reach 14,000 AADT (Moderate scenario)
- Requires significant commuter traffic and development
- Similar to current CP 444 (A20 Portaferry Road): 14,562 AADT
- Would deliver BCR of 20.91 – outstanding value
Development Required for Justification
To achieve the Moderate Scenario (14,000 AADT) which would provide unquestionable economic justification:
Economic Development Needed:
- Housing: 2,000-3,000 new homes across both peninsulas
- Employment: 1,500-2,000 new jobs in tourism, services, light industry
- Commuter base: 500-800 daily commuters to Belfast/Newtownards area
Tourism Growth:
- 40-60% increase in visitor numbers to Strangford Lough attractions
- Enhanced Game of Thrones Trail connectivity
- Better integration with Mourne Coastal Route
- Estimated additional 800-1,200 tourist vehicles/day in peak season
Route Diversion:
- 15-20% of current A7 Downpatrick traffic (currently 25,336 AADT) diverting to use the crossing
- Commercial vehicles optimizing routes
- Estimated 3,000-4,000 vehicles/day from route optimization
Bottom Line
The Department of Infrastructure stated there are insufficient economic benefits to justify the investment Strangford Lough Crossing – Quintin QS, but this analysis suggests they may be underestimating the benefits. The crossing could be economically justified with relatively modest traffic growth:
- ✓ Just 1,340 AADT (2x ferry capacity) meets approval threshold
- ✓✓ 5,000 AADT delivers excellent value (BCR = 7.47)
- ✓✓✓ 14,000 AADT delivers exceptional value (BCR = 20.91)
The real questions are whether the region can deliver the economic development and tourism growth to generate these traffic levels, and whether construction costs can be controlled given the challenging engineering conditions.
Why DfI Stated “No Economic Justification”
Based on the official Department for Infrastructure documents, here are the specific reasons they rejected the crossing:
1. Their Cost-Benefit Analysis Was Fundamentally Flawed
DfI’s Calculation (August 2024):
- Estimated construction cost: £650 million
- Current ferry traffic: 650 vehicles/day
- Ferry fare: £7.70 per car
- Daily revenue at current traffic: £5,005
Their conclusion: “On this basis it would take hundreds of years of operation to justify the construction costs. Alternatively, if the construction cost is to be recouped over a 30 year period then each journey would cost £91 – nearly 12 times more than a single ferry trip.”
The Fatal Flaw in Their Analysis:
DfI only counted fare revenue, not economic benefits. This violates UK transport appraisal standards:
What DfI Counted                       What UK TAG Requires
✗ Ferry fare revenue only (£7.70/trip)✓ Time savings value (£18.55/trip)
✗ No time savings benefits            ✓ Vehicle operating cost savings (£11.13/trip)
✗ No VOC savings                      ✓ Wider economic benefits (+40%)
✗ No WEBs, accident reduction, etc.   ✓ Environmental benefits
Total: £7.70/trip                      Total:~£42/trip economic benefit
DfI counted only 18% of the actual economic benefits.
2. They Used an Inflated Cost Estimate
DfI’s £650m gold plated estimate was based on the Narrow Water Bridge tender (£87m for 190m) extrapolated to 650m, then adding 40% for “water surges,” plus £40m for approach roads, plus £50m for design, plus 20% optimism bias (which you don’t apply to “guessimates”).
Problems with this estimate:
- Narrow Water Bridge Contract was £84m and is due for completion in 2027)
- 40% surge premium is speculative
- No actual engineering study conducted
- “Ground conditions have not been examined”
My analysis used £375m (mid-range), which is more realistic for a 600-800m crossing.
3. They Ignored Induced Demand
DfI assumed traffic would remain at 650 vehicles/day – exactly matching current ferry capacity.
This ignores:
- 24/7 availability vs. 16-hour ferry schedule
- No ferry capacity constraints (currently maxes out at ~640/day)
- Survey data showing 94% dissatisfaction with current service capacity 27th January 2025 – Strangford Ferry – Max 34% actual usage – Quintin QS
- Ferry utilization is only 34% of theoretical maximum, “more related to service constraints than lack of demand” 27th January 2025 – Strangford Ferry – Max 34% actual usage – Quintin QS
- No weekend/evening limitations
- Route diversion from A7/A22 traffic (currently 25,000+ AADT)
4. Strategic Policy Exclusion
“The connection between Strangford and Portaferry does not form part of the strategic transport network, and is considered part of the local transport network so would be considered within the local transport plans.”
Translation: It’s not on our priority list, so we’re not going to seriously consider it.
5. They Dismissed It as “Not a Lifeline Route”
“The Strangford Ferry is not a lifeline service as there is an alternative road connection although it takes approximately 70 minutes to drive the 46 miles from Strangford and Portaferry.”
Yet they ignore that:
- 75km detour = 74 minutes extra travel time
- Additional ambulance resources required for 75km detours 27th January 2025 – Strangford Ferry – Max 34% actual usage – Quintin QS
- Additional transport costs for agricultural products 27th January 2025 – Strangford Ferry – Max 34% actual usage – Quintin QS
- Impact on emergency services response times
6. Ministerial Position
Minister John O’Dowd’s letter (September 2024) stated:
“insufficient economic benefits to justify such a major investment” Strangford Lough Crossing – Quintin QS
“At this time the Department would not have the economic justification to begin to explore a permanent connection. Taking forward a feasibility study is not considered a good use of public funding particularly during a time when the Department is facing significant funding and resource challenges.”
Why Their Analysis is Wrong
Correct Economic Analysis (UK TAG Standards):
Using proper cost-benefit analysis:
Scenario                          AADT      BCR         DfI Would Need
Just to break even (BCR 1.0)       670      1.0         Just 20 more vehicles/day
For approval (BCR 2.0)           1,339      2.0         2x current ferry traffic
Conservative (strong case)       5,000      7.47        7.8x current ferry traffic
Even with DfI’s inflated £650m cost estimate:
- Only 2,100 vehicles/day needed for BCR of 2.0
- That’s just 3.2x current ferry traffic
- Still highly achievable with modest development
The Real Reasons for Rejection
Based on the documents, the actual reasons appear to be:
- Budget constraints – “Department is facing significant funding and resource challenges”
- Political priorities – Not on strategic network priority list
- Flawed methodology – Using fare revenue instead of economic benefits
- Risk aversion – “would likely give false hope to elected representatives and the public”
- Institutional bias – Preference for maintaining status quo (ferry service)
Bottom Line
DfI’s “no economic justification” claim is based on:
- ✗ Counting only 18% of actual economic benefits (fare revenue vs. time/VOC savings)
- ✗ Inflated cost estimates without proper engineering study
- ✗ Assuming zero induced demand
- ✗ Ignoring UK transport appraisal standards (TAG)
My analysis shows:
- ✓ Only 1,340 AADT needed for approval (2.1x ferry)
- ✓ 5,000 AADT delivers BCR of 7.47 (excellent value)
- ✓ Even at £650m cost, only 2,100 AADT needed
The crossing is economically viable – DfI’s methodology was simply wrong. A proper feasibility study with full TAG appraisal would be needed for rigorous analysis.