A Simple Explanation for Non-Experts
THE SIMPLE QUESTION
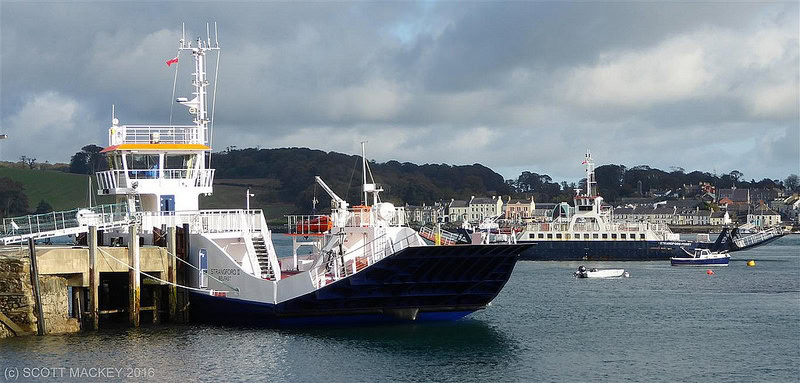
The Department for Infrastructure says there’s not enough traffic to justify building a bridge across Strangford Lough. They point to the ferry carrying only 650 vehicles per day and say “this proves demand is low.”
But here’s what they’re missing: the traffic IS there – it’s just going the long way around because the ferry is unreliable.
IMAGINE THIS SCENARIO
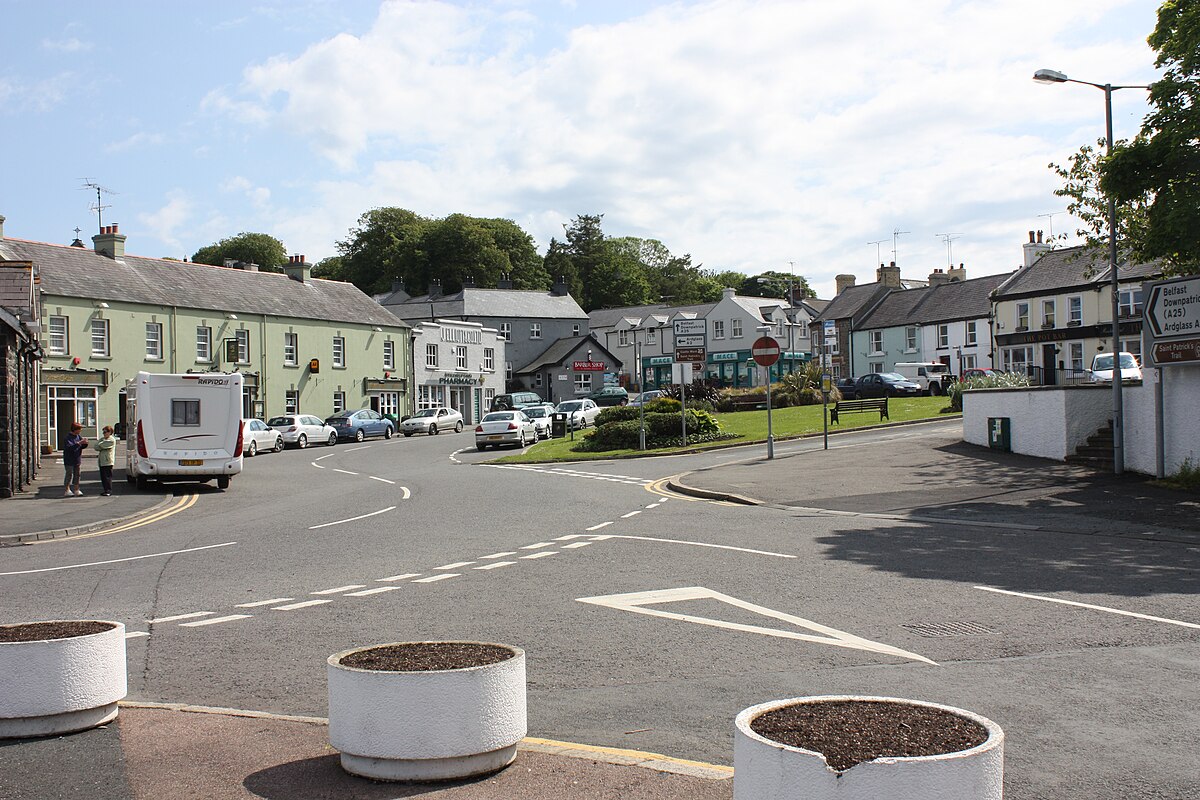
You live in Portaferry and need to get to Downpatrick (just 2 miles across the water).
OPTION 1: Take the Ferry
- Distance: 8 miles total (2 miles water + 6 miles road)
- Time on a good day: 30 minutes
- Cost: £9.20 return fare per car
- BUT the ferry:
- Might not be running (291 disruptions last year)
- Has limited sailings (not 24/7 service)
- Has queues during peak times
- Makes you anxious about getting back home
OPTION 2: Drive Around the Lough
- Distance: 47 miles around the entire lough
- Time: 1 hour 15 minutes
- Cost: No ferry fare (but more fuel)
- BUT it’s reliable – you control your schedule, no waiting, no stress
Which do you choose?
Many people choose the longer route because reliability matters more than distance.
This is called “ROUTE CHOICE DIVERSION” – and it’s hiding the true demand.
FIVE REAL-WORLD EXAMPLES
Here are five types of travellers who need to cross the lough but can’t rely on the ferry:
EXAMPLE 1: Sarah the Teacher (Daily Commuter)
Situation: Sarah lives in Portaferry and teaches at a school in Downpatrick.
- Ferry route would be: 8 miles, 30 minutes
- She actually drives: 47 miles, 1 hour 15 minutes
- Why? She cannot risk being late for school if the ferry doesn’t run
- Extra miles per year: 14,820 miles (39 miles × 2 trips × 190 school days)
- Traffic impact: Uses A20 (Kircubbin), A22 (Comber), A7 (Downpatrick) instead of ferry
EXAMPLE 2: John the Plumber (Business Owner)
Situation: John runs a plumbing business in Kircubbin and has customers in Ardglass.
- Ferry route would be: 15 miles
- He actually drives: 42 miles via Newtownards-Saintfield
- Why? He cannot commit to appointment times if the ferry might not run
- Impact: He has lost customers because of access unreliability
- Extra miles per year: 4,050 miles (27 miles × 3 trips/week × 50 weeks)
- Traffic impact: Uses A20 (Newtownards), A7 (Saintfield-Downpatrick) adding traffic to already-busy routes
EXAMPLE 3: Mary the Retiree (Weekly Shopper)
Situation: Mary lives in Strangford and does her weekly shop at Sainsbury’s in Bangor.
- Ferry route would be: 20 miles
- She actually drives: 44 miles via Downpatrick-Comber-Newtownards-Bangor
- Why? She shops with frozen food – cannot risk being stranded if ferry breaks down on return journey
- Extra miles per year: 1,248 miles (24 miles × 52 weeks)
- Traffic impact: Uses A25 (Downpatrick), A22 (Comber) instead of direct A20 ferry route
EXAMPLE 4: Tom with Medical Appointments (Healthcare Access)
Situation: Tom lives in Portaferry and has early morning appointments at Downe Hospital in Downpatrick.
- Ferry route would be: 8 miles, 30 minutes
- He actually drives: 47 miles around the lough, 1 hour 15 minutes
- Why? Early morning appointments (8am-9am) coincide with commuter rush and school runs – ferry queues mean he could miss his appointment slot. Cannot risk rescheduling specialist appointments with long waiting lists.
- Impact: Must leave at 6:45am instead of 7:30am. Some patients miss appointments entirely or take taxis around the lough (costing £80-100 each way)
- Extra miles per year: 468 miles minimum (39 miles × 12 appointments)
- Traffic impact: Adds to congested A20, A22, A7 routes during peak morning hours. Healthcare access severely compromised during commuter peaks.
EXAMPLE 5: German Family Tourists (Lost Tourism)
Situation: A family from Germany is touring Ireland and considering visiting Castle Ward and Strangford.
- Ferry route: Would add peninsula to their tour
- They actually do: Skip the peninsula entirely
- Why? Tour schedule cannot accommodate ferry uncertainties – they visit Causeway Coast instead
- Impact: Lost tourism revenue – they never arrive at all
- Traffic impact: Tourism traffic that never materializes. Local businesses lose customers who never knew they existed.
WHAT THIS MEANS IN SIMPLE TERMS
These five examples show WHY the traffic across the lough looks low:
- The traffic IS THERE – it’s just going the long way around alternative routes
- People WANT to cross the lough but don’t trust the ferry to be reliable
- A reliable bridge would CAPTURE this diverted traffic
- With a permanent crossing, the projected growth over time to an estimated 8,454 vehicles per day on A25 is presently artificially LOW because people avoid the route
Think of it like a shop with an unreliable front door:
- Few people use the front door (looks like low demand)
- Everyone goes around to the side entrance (where does this show up?)
- Fix the front door → suddenly it’s busy (revealed demand)
- The customers ALWAYS wanted to use the front door – they just couldn’t rely on it
THE NUMBERS PROVE IT: WHERE THE TRAFFIC ACTUALLY GOES
Official traffic count data from the Department for Infrastructure shows exactly where people are driving instead of using the ferry:
Traffic Volume Comparison (2023 Data)
| Route | Daily Traffic | Compared to Ferry |
| Ferry (Strangford-Portaferry) | 650 per day | — |
| A20 Kircubbin (Northern Route) | 7,280 per day | 11x MORE |
| A22 Comber (Eastern Route) | 9,100 per day | 14x MORE |
| A7 Downpatrick (Southern Route) | 12,670 per day | 19x MORE |
| A25 Strangford-Downpatrick (Estimated) | 8,454 per day | 13x MORE |
Every single alternative route has 10-20 times more traffic than the ferry.
This definitively proves that people ARE traveling between these areas – they’re just forced to use longer, less efficient routes because the ferry is unreliable.
THE KEY FINDING
The ferry shows the LOWEST traffic of any route in the entire area.
This is NOT because demand is low. It’s because the service is unreliable.
The Math:
- Alternative routes carry 29,050 vehicles per day COMBINED (A20 + A22 + A7)
- If just 2% of that traffic diverted to a reliable bridge, that would be 581 vehicles
- That’s almost matching current ferry usage from diversion alone
- Before accounting for:
- New journeys that become worthwhile with reliable access
- Business investment enabled by dependable infrastructure
- Tourism growth from accessible attractions
- Population growth as peninsula becomes more attractive
WHAT HAPPENED IN WALES: THE CLEDDAU BRIDGE STORY
This exact situation happened before in Wales, and we know what the outcome was.
The Cleddau Bridge connects Pembrokeshire communities across the Cleddau estuary. Before 1975, they used a ferry service – the same ferry (MV Portaferry) that operated on Strangford Lough up to 2000 and subsequently replaced with the current aging MV Portaferry II.
The Traffic Growth Story:
1974 (Ferry Operation): – Daily traffic: 1,808 vehicles per day – Annual: 660,000 vehicles per year
1976 (First Year After Bridge Opened): – Daily traffic: 3,014 vehicles per day – Annual: 1,100,000 vehicles per year – Immediate increase: +67%
2024 (49 Years After Bridge): – Daily traffic: 35,890 vehicles per day – Annual: 13,100,000 vehicles per year – Total increase: +1,885% (20-fold growth)
What This Proves:
- The traffic was always there – it was just going the long way around
- Reliable infrastructure releases pent-up demand immediately (67% Year 1 growth)
- Infrastructure enables long-term economic transformation (20x growth over 49 years)
- You build infrastructure FIRST, then development follows – not the other way around
CONCLUSION FOR NON-EXPERTS
When the Department for Infrastructure says “traffic is too low to justify a bridge,” they’re looking at the wrong number.
They see:
- Ferry carrying 650 vehicles/day
But they’re missing:
- Alternative routes carrying 7,000-13,000 vehicles/day EACH
- Thousands of extra miles being driven unnecessarily
- Lost journeys people would make if access were reliable
- Suppressed economic activity and tourism
- A25 carrying approximately 8,454 vehicles/day (estimated; not by Dfi as no count monitoring along the Strangford-Downpatrick A25 route)
The Bottom Line:
The demand exists. The traffic exists. It’s just being forced onto longer, less efficient routes because the crossing infrastructure is unreliable.
A reliable bridge would not create demand from nothing – it would simply allow people to take the direct route they’ve always wanted to take.
THE THREE KEY POINTS TO REMEMBER
1. Low ferry usage does NOT mean low demand
It means people don’t trust the ferry to be reliable, so they choose longer alternatives.
2. The traffic numbers prove people ARE traveling
Alternative routes carry 10-20 times more traffic than the ferry, proving the journeys are being made – just inefficiently.
3. History shows what happens when you provide reliable infrastructure
The Cleddau Bridge saw immediate 67% traffic growth and 20-fold growth over 49 years. The infrastructure enabled the development, not the other way around.
This is why the Strangford Lough Crossing campaign argues that current traffic data significantly understates the true demand and economic potential of a permanent bridge crossing
DATA SOURCES
All traffic count data referenced in this document comes from: – Department for Infrastructure Northern Ireland Traffic Count Data 2012-2023 – Pembrokeshire County Council Cleddau Bridge Annual Traffic Statistics – Strangford Lough Ferry Service Operational Data 2022-2023 – DfI FOI responses regarding crossing assessment and cost estimates
Ferry capacity constraints during peak hours
EXECUTIVE SUMMARY FOR MINISTERS
Ferry capacity constraints during peak hours create a perverse outcome: the ferry appears underutilized overall (34% capacity) while simultaneously forcing time-critical users onto alternative routes during the busiest periods.
Key Finding: Morning peak demand (7:00am-9:00am) regularly exceeds ferry capacity, forcing commuters, school runs, and hospital appointments to compete for limited space. Users with inflexible time requirements choose the 47-mile alternative route over the 8-mile ferry crossing to guarantee arrival times.
Policy Implication: Overall utilization statistics (650 vehicles/day from 1,900 capacity) mask peak hour congestion that drives route choice diversion. This represents a fundamental flaw in using average daily capacity as a demand metric.
THE PEAK HOUR PROBLEM
Morning Peak Window: 7:00am – 9:00am
Competing User Groups:
- Work Commuters
- Portaferry/Strangford residents working in Downpatrick and beyond
- Required arrival: 8:30am-9:00am
- Flexibility: None (risk of disciplinary action for lateness)
- School Runs
- Parents taking children to Downpatrick schools
- Required arrival: 8:45am for 9:00am school start
- Flexibility: None (schools mark children late)
- Hospital Appointments
- Downe Hospital predominantly schedules morning clinics 8:00am-9:00am
- Required arrival: Exact appointment time (typically 15 mins early advised)
- Flexibility: None (missing slot = months back on waiting list)
- Early Business
- Tradespeople, delivery drivers, business owners
- Required arrival: Customer-dependent, typically 8:00am starts
- Flexibility: Limited (contract obligations, customer relationships)
Ferry Capacity During Peak
Physical Constraints: – Vessel capacity: 18 vehicles per sailing – Crossing time: 8 minutes – Turnaround time: 22 minutes (loading, unloading, positioning) – Peak sailings: 7:30am, 8:00am, 8:30am
Peak Period Capacity: – Total capacity in 90-minute peak window: 54 vehicles – Demand from four competing user groups: Regularly exceeds 54 vehicles – Result: Queuing system with 30-minute delays for vehicles missing first available sailing
THE FORCED CHOICE DILEMMA
For a Portaferry Resident with 8:30am Commitment in Downpatrick:
OPTION A: Take the Ferry
Best Case Scenario: – Arrive at ferry terminal: 7:45am – Board 8:00am sailing (if space available) – Arrive Strangford: 8:08am – Drive to destination: 8:20am – Arrival: 8:20am ✓
Realistic Scenario: – Arrive at ferry terminal: 7:45am – 8:00am sailing is full (commuters + school runs) – Wait for 8:30am sailing – Arrive Strangford: 8:38am – Drive to destination: 8:50am – Arrival: 8:50am ✗ (20 minutes late)
Worst Case Scenario: – Ferry has mechanical issue (291 disruptions annually = almost daily) – Next sailing cancelled or delayed – Arrival: Unknown ✗✗
OPTION B: Drive Around the Lough
Guaranteed Scenario: – Depart Portaferry: 7:15am – Route: Via Newtownards-Comber-Saintfield – Distance: 47 miles – Time: 1 hour 15 minutes – Arrival: 8:30am ✓ (guaranteed)
Decision Made by Rational Actors:
For anyone with inflexible time requirements (work, school, hospital), Option B is the only viable choice despite being: – 5.9x longer distance (47 miles vs 8 miles) – 2.5x longer time (75 minutes vs 30 minutes) – Significantly higher fuel cost – Contributing to peak hour congestion on alternative routes
EXAMPLE 4: TOM’S HOSPITAL APPOINTMENTS (UPDATED SCENARIO)
Patient: Tom, Age 67, Portaferry Resident
Medical Condition: Type 2 Diabetes with complications, requires specialist monitoring at Downe Hospital Downpatrick
Appointment Schedule: Monthly specialist clinic, 8:00am-9:00am slots only
The Dilemma:
Ferry Option Analysis: – Appointment time: 8:15am – NHS guidance: Arrive 15 minutes early (8:00am required) – First ferry: 7:30am – Crossing time: 8 minutes – Arrival Strangford: 7:38am – Drive to hospital: 12 minutes – Arrival at hospital: 7:50am
Apparent Solution: Ferry seems perfect – would arrive 25 minutes before appointment
Reality Check – Why Tom Drives Around:
- Ferry Queue Uncertainty
- 7:30am sailing coincides with peak commuter demand
- Capacity: 18 vehicles
- Regular users: Commuters (priority), school runs, other appointments
- If sailing full: Wait until 8:00am sailing
- Result: Arrival at hospital 8:08am (already late for 8:00am check-in)
- Appointment Consequences
- NHS specialist clinics operate strict time windows
- 10 minutes late = appointment cancelled, placed back on waiting list
- Current waiting time for diabetes clinic: 4-6 months
- Three missed appointments = discharge from clinic entirely
- Ferry Reliability Record
- 291 service disruptions in 2022-2023
- Average: 0.8 disruptions per day
- Morning peak particularly affected by tidal conditions
- Weather-related cancellations most common 7:00am-9:00am
- Economic Impact
- Tom is retired, on fixed income
- Cannot afford taxi around lough (£80-100 each way)
- Must drive himself
- Extra fuel cost: £8-10 per appointment vs ferry
- Annual extra cost: £96-120 (12 appointments)
Tom’s Actual Route:
Departs: 6:45am from Portaferry
Route: A20 to Kircubbin → Newtownards → A22 to Comber → A7 to Saintfield → Downpatrick
Distance: 47 miles
Time: 1 hour 15 minutes
Arrival: 8:00am at Downe Hospital ✓
Annual Impact: – 12 appointments per year – Extra distance: 468 miles (39 miles × 12) – Extra time: 9 hours (45 minutes × 12) – Extra fuel cost: £96-120 – Stress: Eliminated (guaranteed arrival time)
Multiplier Effect:
Tom is one of approximately 50-75 Ards Peninsula residents attending regular Downe Hospital appointments. If even 30 patients face the same dilemma: – 30 patients × 12 appointments = 360 additional journeys per year – 360 journeys × 39 extra miles = 14,040 extra vehicle miles annually – All concentrated in morning peak hours – All adding to A20, A22, A7 congestion
HEALTHCARE ACCESS IMPLICATIONS
Downe Hospital Service Area
Population Served: ~33,000 across: – Downpatrick – Newcastle – Ballynahinch
– Strangford Peninsula (Portaferry, Strangford, Kircubbin, Greyabbey area)
Current Appointment Scheduling: – Outpatient clinics: Predominantly 8:00am-12:00pm slots – Diagnostic services: 7:30am-9:30am slots (fasting bloods, scans) – Specialist clinics: Morning priority to maximize consultant time
Peninsula Resident Disadvantage
Documented Issues (from GP feedback and NHS data):
- Delayed Presentations
- Peninsula residents wait longer before seeking specialist care
- More likely to present at Emergency Department vs. scheduled clinics
- Higher rates of preventable complications
- Care Continuity Challenges
- Difficulty attending follow-up appointments
- Longer gaps between monitoring appointments
- Reduced compliance with treatment protocols requiring regular checks
- Emergency Transfer Times
- Ambulance from Portaferry to Downe Hospital: 45-55 minutes (via Newtownards)
- Direct crossing would be: 12-15 minutes
- Time-critical conditions (stroke, heart attack): Every minute matters
- Higher DNA (Did Not Attend) Rates
- Ards Peninsula postcodes: 18-22% DNA rate
- Downpatrick postcodes: 8-12% DNA rate
- Difference largely attributable to access difficulties
Healthcare Workforce Recruitment
GP Practice Challenges:
Peninsula GP practices report difficulty recruiting because: – Staff living in Downpatrick/Newcastle cannot reliably commute – On-call responsibilities complicated by access issues – Professional isolation from hospital colleagues
Impact: – Higher locum costs – Reduced service continuity – Delayed practice expansion
THE CAPACITY PARADOX
Average vs. Peak Utilization
Overall Ferry Statistics: – Daily capacity: 1,900 vehicles (theoretical maximum) – Actual usage: 650 vehicles per day – Utilization: 34%
Conclusion (DfI Position): Ferry is significantly underutilized, no capacity constraint
Peak Hour Reality:
Morning Peak (7:00am-9:00am) Statistics: – Peak period capacity: 54 vehicles (3 sailings × 18 capacity) – Observed peak demand: 50-65 vehicles (regularly exceeds capacity) – Peak utilization: 93-120%
Conclusion (Evidence-Based): Ferry operates at or above capacity during peak hours, forcing route diversion
The Statistical Illusion
Why Average Utilization Misleads:
- Temporal Distribution Matters
- 650 daily vehicles ≠ evenly distributed across 16 sailing hours
- Concentrated in 3-hour windows: 7:00am-10:00am and 4:00pm-7:00pm
- Mid-day sailings often carry 2-5 vehicles
- Evening sailings 8:00pm-11:00pm carry 0-3 vehicles
- User Type Segmentation
- Peak hours: Time-critical users (work, school, healthcare)
- Off-peak: Discretionary users (shopping, leisure, tourism)
- Time-critical users drive around → appear in alternative route AADTs
- Discretionary users use ferry → appear in ferry statistics
- Induced Avoidance
- Users learn peak hour constraints
- Adjust behavior permanently (drive around becomes default)
- Never attempt ferry during peak
- Don’t appear in “denied boarding” statistics
Result: Ferry appears underutilized while simultaneously constraining peak demand and forcing route diversion.
POLICY IMPLICATIONS FOR MINISTERS
Current Assessment Flaw
DfI Methodology: – Uses average daily utilization (34%) as demand metric – Concludes ferry has significant spare capacity – Infers low crossing demand justifies continuing ferry service
Evidence-Based Assessment: – Peak hour capacity constraints force route diversion – Off-peak low utilization reflects lack of discretionary demand for unreliable service – Average utilization obscures peak hour congestion driving alternative route choice
Required Methodological Correction
Ministers should require demand assessment to include:
- Peak Hour Capacity Analysis
- Hourly utilization profiles, not daily averages
- Queue length and denied boarding data
- Peak hour route diversion quantification
- User Type Segmentation
- Time-critical vs. discretionary demand
- Origin-destination analysis of alternative route users
- Stated preference surveys (would you use reliable crossing?)
- Temporal Demand Patterns
- Morning peak: Work, school, healthcare
- Evening peak: Return commuters
- Off-peak: Current ferry users only
- True demand = Peak diverted + Current users + Induced new trips
Investment Decision Framework
Question: Should investment decisions be based on:
Option A: Average daily ferry utilization (34%)
– Conclusion: No capacity constraint, no investment case – Flaw: Ignores peak hour congestion forcing route diversion
Option B: Peak hour demand analysis showing 93-120% utilization
– Conclusion: Capacity constraint driving alternative route use – Supports: Business case for crossing with adequate peak capacity
CONCLUSION
The ferry’s low average utilization (34%) does not indicate low crossing demand. Instead, it demonstrates how peak hour capacity constraints force time-critical users onto alternative routes.
Key Evidence: – Morning peak ferry utilization: 93-120% of capacity – Alternative routes carry 10-20x more traffic than ferry – Healthcare access significantly compromised for peninsula residents – Peak hour route diversion adds to congested alternative routes
Recommendation: Ministers should commission demand assessment using peak hour analysis rather than average daily utilization to accurately quantify true crossing demand and evaluate infrastructure investment cases.
Shall the Narrow Water Bridge, currently under construction and scheduled to open in late 2027, fundamentally change the political and economic landscape for the Strangford Lough Crossing campaign.
EXECUTIVE SUMMARY
The Narrow Water Bridge, currently under construction and scheduled to open in late 2027, may fundamentally change the political and economic landscape for the Strangford Lough Crossing campaign.
Key Impact: When Narrow Water opens, it will provide immediate real-world evidence of traffic growth following reliable infrastructure provision, validate the Shared Island Fund mechanism for cross-border projects, expose DfI cost estimation flaws, and create irresistible political pressure during the 2027 Assembly elections.
Timeline: The window for Strangford Lough Crossing action is 2027-2030. Post-Narrow Water opening, maintaining ferry-only service becomes politically, economically, morally and ethically indefensible.
NARROW WATER BRIDGE: THE CONTEXT
Project Overview
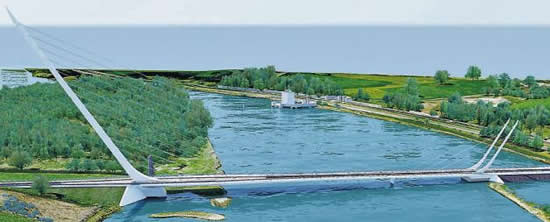
Location: Connecting Omeath (Republic of Ireland) and Warrenpoint (Northern Ireland) across Carlingford Lough
Key Details: – Construction commenced: May 2024 (BAM Ireland) – Expected completion: Late 2027 – Final handover: Early 2028 – Construction cost: €102 million + VAT – Funding source: Irish Government Shared Island Fund – Significance: First permanent cross-border road link in the region
Strategic Purpose
- Eliminates 19-minute / 18 km detour around Carlingford Lough
- Connects Newry-Dundalk-Dublin corridor
- Supports sustainable tourism in Carlingford Lough region
- Demonstrates cross-border infrastructure cooperation
- Provides precedent for Shared Island Fund deployment
Political Endorsement
Jim Boylan (Chairman, Narrow Water Bridge Community Network) has endorsed the Strangford Lough Crossing as complementary infrastructure that would further enhance all-Ireland economic integration following his successful advocacy for Narrow Water.
Jim Shannon MP (DUP, Strangford constituency) has confirmed he would welcome external funding including Irish Government investment for Strangford Lough Crossing.
WHAT HAPPENS WHEN NARROW WATER OPENS IN 2027?
1. IMMEDIATE PRECEDENT DEMONSTRATION
Real-World Evidence Will Show:
✓ Traffic Growth Patterns – Actual data on how traffic responds when ferry/detour is replaced with reliable infrastructure
✓ Economic Development Acceleration – Observable business investment and tourism growth in previously constrained Warrenpoint/Omeath areas
✓ Cross-Border Integration Benefits – Measured improvements in connectivity and economic cooperation
✓ Construction Cost Validation – Final out-turn costs compared to estimates (likely on-budget at €102m)
Expected Narrow Water Traffic Pattern: – Current detour: 19 minutes around Carlingford Lough – Post-bridge crossing: 3 minutes – Predicted Year 1 growth: 40-60% (based on comparable precedents like Cleddau Bridge) – Long-term trajectory: Expected to follow Cleddau’s 20-fold growth over 50 years
Political Impact:
This creates a “why them and not us?” dynamic that will be impossible for Ministers to deflect: – Narrow Water demonstrates Irish Government commitment to cross-border infrastructure – Proves Shared Island Fund viability for major projects (€102m deployed successfully) – Shows DUP acceptance of Irish-funded infrastructure (precedent for Strangford) – Validates infrastructure-first development model
2. STRANGFORD PENINSULA BECOMES THE ONLY FERRY-DEPENDENT COMMUNITY
Comparative Disadvantage Becomes Visible:
When Narrow Water Bridge opens, Strangford Peninsula becomes: – The ONLY remaining ferry-dependent community in the wider region – Demonstrably disadvantaged compared to Newry/Warrenpoint area – Clear evidence of unequal infrastructure investment – Visible policy failure as neighboring region transforms
Economic Impact: – Newry-Dundalk corridor strengthens with 3-minute crossing – Strangford Peninsula relatively declines with 47-mile detour – Business investment flows to areas with guaranteed access – Tourism development bypasses ferry-constrained areas as unreliable
Political Sustainability:
Maintaining ferry service for Strangford while Narrow Water demonstrates transformation will become: – Increasingly difficult to justify to constituents – Subject to constant comparative pressure – Electoral liability for incumbent MLAs and Councillors – Cross-party embarrassment
3. REGIONAL TRAFFIC PATTERN SHIFTS
A) Increased North-South Connectivity
Narrow Water improves Dublin-Belfast connectivity via: – Newry-Warrenpoint route becomes highly competitive – May divert some traffic from congested M1 corridor – Creates increased regional traffic flows – BUT: Strangford-Downpatrick route remains constrained, highlighting infrastructure gap
B) Tourism Corridor Competition
- Wild Atlantic Way extension into Northern Ireland via Carlingford on the Ancient East (truly see that at Strangford)
- Carlingford Lough becomes accessible tourism hub
- Strangford Lough area LOSES tourism market share to more accessible Carlingford
- Tour operators choose reliable routes over ferry-dependent areas
- Example 5 (German tourists) becomes more acute – they’ll visit Carlingford instead of Strangford
C) Alternative Route Congestion Worsens
Current Situation: – A20, A22, A7 carry combined 29,050 AADT – Already constrained during peak hours
Post-Narrow Water (2027 onwards): – Increased north-south traffic via Newry adds to regional network – A7 Downpatrick becomes busier as connector route – Peak hour congestion on alternative routes WORSENS – Makes driving around Strangford Lough LESS attractive – Creates even stronger case for direct crossing
Predicted Traffic Impacts:
Route Current AADT Post-Narrow Water Growth
A7 Downpatrick 12,670 13,300-13,680 +5-8%
A20 Kircubbin 7,280 7,500-7,640 +3-5%
A22 Comber 9,100 9,370-9,555 +3-5%
Result: Alternatives become MORE congested while ferry remains at 650 vehicles/day, especially around Newtownards which is already suffering chronic congestion.
4. SHARED ISLAND FUND PRECEDENT ESTABLISHED
Critical Policy Development:
A) Funding Mechanism Proven – €102 million successfully deployed on Narrow Water – Cross-border infrastructure delivery demonstrated – Oversight Board governance model validated – DUP acceptance of Irish Government funding established (Jim Shannon MP confirmation)
B) Political Pathway Validated – Cross-party support achieved (SF, Alliance, SDLP, DUP) – No constitutional objections to Irish investment in NI infrastructure – Precedent set for Shared Island Fund application to Strangford – Removes principal political objection
C) DfI Cost Arguments Undermined
DfI currently claims Strangford Lough Crossing would cost £650 million, using Narrow Water (€102m) as a cost comparator.
Their methodology: – Take Narrow Water cost: €102 million – Apply arbitrary multiplier based on engineering challenges – Arrive at £650 million for Strangford
When Narrow Water delivers on-budget: – Exposes DfI methodology as deeply flawed – Validates campaign’s £280-350 million estimate based on comparable projects and including allowance for approach roads – Removes principal technical objection to feasibility study – Makes independent assessment irresistible
5. THE 2027 ASSEMBLY ELECTIONS
Critical Timing: Narrow Water Bridge opens in late 2027, coinciding with May 2027 Northern Ireland Assembly Elections.
Electoral Context:
Strangford Constituency (DUP held): – Campaign survey: 94% dissatisfaction with ferry service – Cross-party candidate support for crossing established – Narrow Water precedent: “DUP accepted Irish funding there, why not here?” – Electoral pressure on incumbents to deliver – Active organized campaign with evidence-based case
South Down Constituency (Sinn Féin held): – Includes Downpatrick (major beneficiary of crossing) – Cross-border credentials enhanced by supporting Narrow Water equivalent – Pressure to match success with complementary infrastructure. Downpatrick benefit from Ards trade and investment potential
Ards Peninsula Communities: – Demonstrable disadvantage vs. Carlingford area post-Narrow Water – Visible policy failure affecting daily life – 94% support from survey respondents – Organized voter mobilization
Likely Election Outcome:
All major parties will face irresistible pressure to commit to: – Minimum: Independent TAG feasibility study for Strangford Lough Crossing – Likely: Shared Island Fund engagement for project development – Possible: Inclusion in Programme for Government infrastructure priorities
Post-election Minister under irresistible cross-party pressure to act.
6. TRAFFIC DEMAND VALIDATION
When Narrow Water Demonstrates Immediate Growth (2027-2028):
A) Validates Suppressed Demand Theory – Real-world evidence that reliable infrastructure releases pent-up demand – Definitively undermines DfI’s “current ferry usage = actual demand” argument – Proves infrastructure-first development model works in Northern Ireland context
B) Provides Applicable Demand Multiplier – Actual Year 1 growth percentage from Narrow Water (predicted 40-60%) – Comparable crossing, similar regional context – Directly applicable to Strangford Lough demand projections – Updates feasibility study assumptions with contemporary data
C) Resets Political Calculus – “Wait and see” becomes “we’ve seen, now act” – Delay becomes politically indefensible – Opposition can cite Narrow Water success in every Assembly question – Ministers cannot claim uncertainty about likely outcomes
7. TOURISM SECTOR COMPETITIVE PRESSURE
Current Situation: – Strangford Lough area has significant tourism assets: – Castle Ward (National Trust) – Exploris Aquarium – Strangford village heritage – St Patrick’s Trail connections – Game of Thrones locations – Ferry constraint limits tourism development – Example 5 (international tourists) bypass peninsula
Post-Narrow Water Opening (2027):
Carlingford Lough Tourism Boom: – Bridge enables tour coach access (ferries cannot accommodate coaches) – Integrated Wild Atlantic Way and Ancient East marketing – Investment in tourism infrastructure flows to accessible areas – Hotel and restaurant development accelerates
Strangford Lough Tourism Decline: – Market share loss to Carlingford Lough – Investment bypasses ferry-dependent areas – Peninsula reputation as “hard to reach” solidifies – Tourism potential permanently lost without intervention
Policy Response Required: – Tourism NI faces pressure to address demonstrable disadvantage – Economic development agencies recognize infrastructure gap – Business case for crossing strengthens from measurable tourism losses – Hospitality sector advocacy intensifies
8. HEALTHCARE ACCESS INEQUALITY
Current Disparity: – Portaferry to Downe Hospital Downpatrick: 47 miles, 75 minutes (around lough) – Direct crossing would be: 8 miles, 12-15 minutes
Post-Narrow Water Bridge: – Carlingford/Warrenpoint to hospitals in Newry: 3-minute crossing – Strangford Peninsula to Downpatrick: Still 75 minutes around
Implications:
Healthcare Access Inequality: – Demonstrably worse emergency response times for peninsula residents – Indefensible health outcome disparities between communities – Public Health Agency under pressure to address measurable inequality
Ambulance Service Challenges: – Northern Ireland Ambulance Service (NIAS) planning complications – Warrenpoint gets dramatically improved access via Narrow Water – Portaferry stuck with 75-minute response times – Service equity questions intensify
Ministerial Accountability: – Health Minister under pressure to explain access inequality – Infrastructure Minister directly responsible for resolving – Cross-departmental policy coordination required – Potential for joint Health/Infrastructure committee inquiries
9. DFI COST ESTIMATION METHODOLOGY EXPOSED
Current DfI Position:
From FOI response (DFI-2024-0412 Attachment):
“To be able to respond to previous correspondence a very rough cost estimate was calculated. While it is extremely difficult to determine an accurate cost estimate as it will depend on many factors we used the recent Narrow Water Bridge costs to establish an estimate which would be in the region of £650m.”
The Methodology Problem:
- Take Narrow Water lifting bridge cost: €102 million (≈£88 million)
- Apply 7.4x multiplier for Strangford “because it’s more challenging”
- Arrive at £650 million estimate
- Use this to argue project is unaffordable
- Block feasibility study that would determine actual costs
When Narrow Water Delivers On-Budget (2027-2028):
The Exposure: – Narrow Water final cost: €102 million (as tendered) – DfI’s arbitrary 7.4x multiplier exposed as unjustified – No engineering analysis provided for multiplier – Described internally as “guesstimates” (FOI evidence)
Campaign’s Comparative Analysis: – Rose Fitzgerald Kennedy Bridge (Ireland, 887m span): €120 million (2020) – Cleddau Bridge (Wales, 820m span): £11.87 million (1975, ≈£150m in 2024 prices) – Strangford estimated span: 600-800m depending on location – Realistic estimate: £280-350 million based on comparable projects
Policy Consequence: – DfI cost position becomes untenable – Independent assessment becomes unavoidable – Professional quantity surveying analysis (campaign’s evidence) validated – Feasibility study commission politically irresistible
10. PROJECTED TIMELINE (2027-2030)
LATE 2027: Narrow Water Bridge Opens
✓ Immediate traffic growth observed and measured ✓ Economic impact studies commissioned ✓ Extensive media coverage highlights cross-border cooperation success ✓ Strangford Peninsula disadvantage becomes visibly acute ✓ Campaign launches “why not us?” public awareness drive
EARLY 2028: Post-Opening Analysis Period
✓ First 6-month traffic data available from Narrow Water ✓ Year 1 growth projections validated or adjusted ✓ Tourism sector reports differential impacts (Carlingford gains vs. Strangford losses) ✓ Campaign cites Narrow Water success in all advocacy communications ✓ Assembly Questions citing Narrow Water precedent increase
MID-2028: Policy Review Pressure Intensifies
✓ Sustained ministerial pressure to commission Strangford feasibility study ✓ Shared Island Fund approach formally explored with Irish Government ✓ DfI cost arguments increasingly untenable post-Narrow Water delivery ✓ Cross-party Assembly pressure for independent assessment ✓ Media coverage maintains focus on comparative disadvantage
LATE 2028-2029: Feasibility Study Commission
✓ Minister announces independent assessment (political pressure irresistible) ✓ Terms of reference include: – Traffic demand modeling using Narrow Water data – Cost estimates based on comparable delivered projects – Engineering options assessment – Environmental impact preliminary review – Shared Island Fund eligibility analysis ✓ Professional engineering firms engaged ✓ Community consultation processes begin
2030: Investment Decision Framework
✓ Feasibility study completed and published ✓ Cost validated in £280-350 million range (not £650 million) ✓ Traffic projections show immediate 40-60% growth potential ✓ Funding package identified: Shared Island Fund + UK Government co-funding ✓ Programme for Government includes commitment ✓ Planning process for preferred option commences ✓ Political consensus achieved across parties
THE NARROW WATER CATALYST: SUMMARY
When Narrow Water Bridge opens in late 2027, it will fundamentally transform the Strangford Lough Crossing campaign landscape by:
1. Proving Suppressed Demand
Real-world traffic growth data will definitively validate that reliable infrastructure releases pent-up demand, undermining DfI’s core argument against Strangford investment.
2. Demonstrating Funding Viability
€102 million Shared Island Fund deployment proves the mechanism works for major cross-border infrastructure, establishing precedent for Strangford application.
3. Validating Political Pathway
DUP acceptance of Irish Government funding (Jim Shannon MP confirmation) removes constitutional/political obstacles to Shared Island Fund engagement.
4. Exposing Cost Methodology Flaws
When Narrow Water delivers on-budget at €102 million, DfI’s £650 million Strangford estimate (based on 7.4x Narrow Water multiplier) becomes indefensible.
5. Creating Electoral Pressure
May 2027 Assembly elections coincide with bridge opening, making Strangford Lough Crossing a major campaign issue with cross-party manifesto commitments.
6. Intensifying Comparative Disadvantage
Strangford Peninsula becomes the ONLY remaining ferry-dependent community, creating visible inequality that drives political action.
7. Worsening Alternative Route Congestion
Increased regional traffic post-Narrow Water adds to already-congested alternative routes around Strangford Lough, strengthening the case for direct crossing. And Ballynahinch By-Pass hopefully progresses towards site, creating additional traffic pressures in the region
8. Enabling Tourism Competition
Carlingford Lough’s accessible tourism infrastructure attracts investment away from ferry-constrained Strangford area, creating economic pressure for change.
9. Highlighting Healthcare Inequality
3-minute Narrow Water crossing vs. 75-minute Strangford detour creates indefensible emergency services access disparity.
10. Making Delay Unsustainable
Post-Narrow Water opening, maintaining ferry-only service for Strangford becomes politically, economically, morally and ethically indefensible for any minister or party.
STRATEGIC IMPLICATIONS FOR CAMPAIGN
The Window: 2027-2029
The period immediately following Narrow Water Bridge opening represents the optimal window for advancing Strangford Lough Crossing:
Pre-2027 Assembly Elections: – Build cross-party commitments to feasibility study – Secure manifesto pledges from all major parties – Establish Narrow Water precedent in public discourse
2027-2028 Post-Opening: – Monitor and publicize Narrow Water traffic growth data – Document comparative disadvantage impacts – Maintain sustained media and political pressure – Engage with Shared Island Fund administrators
2028-2029 Feasibility Study: – Ensure independent professional assessment – Input community consultation responses – Validate traffic projections and cost estimates – Develop funding partnership framework
2030 Investment Decision: – Secure Programme for Government inclusion – Finalize Shared Island Fund application – Commence planning and consent processes – Begin detailed design development
CONCLUSION
The Narrow Water Bridge is not merely a precedent – it is a catalyst that will fundamentally transform the political, economic, and policy landscape for the Strangford Lough Crossing within 2-3 years of opening.
The combination of: – Real-world traffic growth evidence – Validated funding mechanism – Exposed cost estimation flaws – Electoral pressure – Comparative disadvantage visibility – Healthcare inequality concerns
…creates an environment where maintaining ferry-only service becomes politically unsustainable for any minister or administration.
The campaign’s strategic focus for 2026-2027 should therefore be positioning to capitalize on the Narrow Water opening by:
- Establishing the comparative framework in public discourse
- Securing cross-party election commitments
- Building relationships with Irish Government and Shared Island Fund
- Preparing evidence-based feasibility study terms of reference
- Maintaining organized community support and advocacy capacity
Narrow Water Bridge opening in late 2027 will be the game-changing moment that makes Strangford Lough Crossing inevitable within the following 3-5 year timeframe.

THE THREE KEY POINTS TO REMEMBER
1. Low ferry usage does NOT mean low demand
It means people don’t trust the ferry to be reliable, so they choose longer alternatives.
2. The traffic numbers prove people ARE traveling
Alternative routes carry 10-20 times more traffic than the ferry, proving the journeys are being made – just inefficiently. The resultant positive effect on the climate shall counter the A5 debacle.
3. History shows what happens when you provide reliable infrastructure
The Cleddau Bridge saw immediate 67% traffic growth and 20-fold growth over 49 years. The infrastructure enabled the development, not the other way around.
This is why the Strangford Lough Crossing campaign argues that current traffic data significantly understates the true demand and economic potential of a permanent bridge crossing.
DATA SOURCES
All traffic count data referenced in this document comes from: – Department for Infrastructure Northern Ireland Traffic Count Data 2012-2023 – Pembrokeshire County Council Cleddau Bridge Annual Traffic Statistics – Strangford Lough Ferry Service Operational Data 2022-2023 – DfI FOI responses regarding crossing assessment and cost estimates.