Existing AADT Figures Around Strangford Lough
Traffic data for the area is primarily managed by the Department for Infrastructure (DfI) in Northern Ireland, with annual counts available through their traffic census reports and datasets. However, specific AADT (Annual Average Daily Traffic) figures for roads immediately adjacent to Strangford Lough are not always broken out in aggregate reports, as they focus on permanent counter sites across the network.
Based on available data:
- Current Crossing (Ferry Service): The Strangford Lough Ferry between Portaferry and Strangford carries approximately 237,250 vehicles annually (2024 DfI figures), equating to an AADT of about 650 vehicles per day. This represents the direct cross-lough traffic volume, with utilization rates historically below 34% of theoretical maximum capacity due to constraints like weather, maintenance, and peak-time limitations. quintinqs.com Passenger numbers are not separately detailed in vehicle-focused counts, but the service handles up to 266 passengers per vessel.
- Detour Roads (A22 and A2): These form the primary 75 km detour route around the lough (via Downpatrick or Newtownards). Specific AADT from DfI counters near the area includes:
- A22 near Killyleagh (west side, approaching Strangford): Rural A-class roads like this typically see 2,000–5,000 vehicles per day based on 2014–2023 census trends, with peak hourly flows of 200–400 vehicles. No exact 2024/2025 figures for this segment were found, but comparable rural sections in County Down average ~3,500 AADT.
- A2 near Portaferry (east side): Similar rural volumes, estimated at 1,500–4,000 AADT, with lower peaks (~150–300 per hour) due to the peninsula’s lower density. General DfI data for A-class roads in rural areas (non-motorway) averages 4,000–8,000 AADT regionally, but Strangford-adjacent segments are on the lower end due to limited through-traffic.
These detour volumes include traffic avoiding the ferry due to unreliability or scheduling, plus local trips.
Overall, Strangford Lough’s transport network sees suppressed demand, with hidden costs from detours estimated at £380–750 million over 30 years (including vehicle operating expenses and time losses).
Most Economic Hypothetical AADT Figures with Strangford Lough Crossing (SLC)

The proposed SLC (a fixed bridge or corridor) aims to replace the ferry with a multi-modal link, capturing detour traffic, releasing suppressed demand, and inducing new trips through better connectivity.
Hypothetical AADT estimates (drawing from the Cleddau Bridge in Wales as a precedent) vary by growth scenario, with economic viability assessed via Benefit-Cost Ratios (BCR) and net present value over 30 years. The project cost is £300–400 million, with funding scenarios emphasizing 50% Irish Government support to achieve “high value for money” (BCR >2.0 per Treasury Green Book).
Key scenarios (annual crossings converted to AADT):
- Conservative (Year 1 Post-Opening, ~2029): 885,900 annual crossings → AADT ≈ 2,427 vehicles per day. BCR 1.9:1; viable but borderline, assuming minimal growth and current ferry-like demand. This reflects immediate capture of existing detour/ferry traffic plus basic reliability gains.
- Moderate Growth (Year 10, ~2039): 2,000,000 annual crossings → AADT ≈ 5,479 vehicles per day. BCR 2.3:1; considered the most balanced for economic viability, with toll revenues (£6.3 million/year at £3.50 average toll) covering operations and yielding net benefits of £636–1,094 million over ferry continuation. Factors include population-driven demand (Ards & North Down: 163,659; Newry, Mourne & Down: 182,074) and reduced emissions/journey times.
- Mature Operations (Year 20–25, ~2049–2054): 3,500,000 annual crossings → AADT ≈ 9,589 vehicles per day. BCR up to 3.0:1; highest long-term value, with revenues (£12.6 million/year at £4.00 toll) and wider benefits (£760–1,245 million PV, including £80–120 million in vehicle savings and £60–100 million in healthcare access). This assumes full modal shift, tourism growth, and integration with regional plans like the Sub-Regional Economic Plan (October 2024).
The moderate growth scenario (AADT ~5,479) is deemed most economic, as it exceeds BCR thresholds without over-relying on aggressive growth assumptions. Toll structures (e.g., £3–4 for cars, discounts for locals, free for bikes) and additional revenues (£10.5–24 million from developments) enhance viability. Risks like construction overruns are mitigated through shared funding, making it superior to ongoing ferry costs (£3.52 million/year).
More Efficient/Load Factor Public Transport with SLC
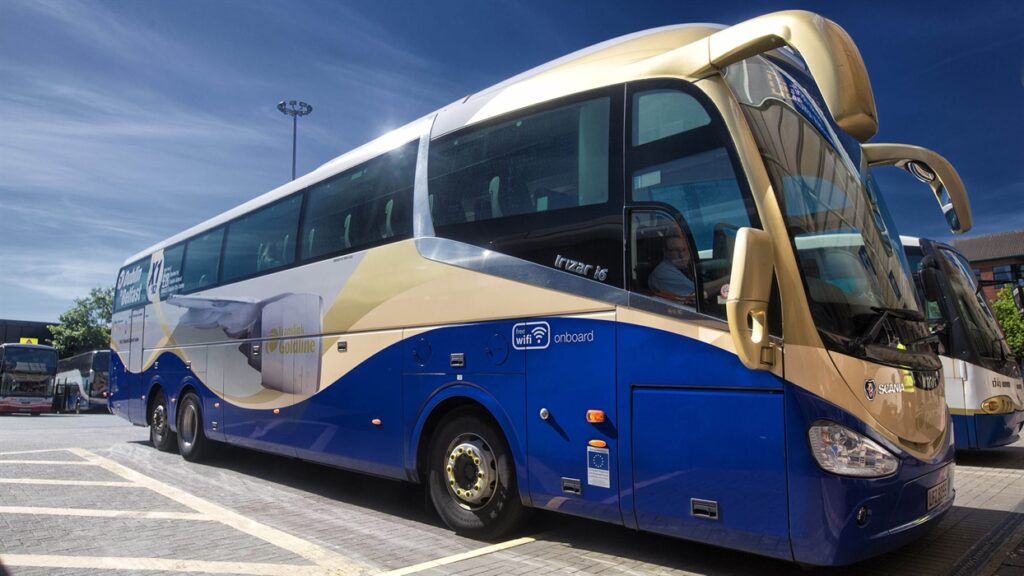
Translink’s bus services (e.g., Ulsterbus routes 9/10 Belfast–Portaferry and 16e Downpatrick–Strangford) currently face inefficiencies from ferry dependencies: infrequent schedules (every 4 hours in rural areas), transfer delays (30–45 minutes including waits), and detours adding 30–60 minutes. Load factors (passenger occupancy rates) are low in rural NI, with Belfast buses historically ~10–20% below other UK city averages due to underutilization.
Around Strangford, factors like weather disruptions and limited 24/7 access suppress ridership.
The SLC would enhance efficiency and load factors by:
- Route Optimization: Direct cross-lough bus extensions (e.g., Downpatrick–Portaferry in 15–20 minutes vs. current 30–45), enabling express services and higher frequencies. This reduces operational costs (fewer transfers) and aligns with Translink’s “Bus Better Connected” strategy for integrated networks. translink.co.uk
- Ridership and Load Factor Boost: Shorter, reliable journeys could increase demand by 3–4x (mirroring Cleddau-like growth), shifting users from cars to buses and raising occupancy from current rural lows (20–40%) to urban-like levels (50–70%). Enhanced access to jobs, education, and tourism (e.g., Castle Ward) supports this, with potential for zero-emission buses under Climate Action Plan 2024.
- Emission and Cost Savings: Eliminates ferry diesel/idling (6–12 tonnes CO₂/year) and detours, improving per-passenger efficiency. Translink could reallocate subsidies (~£1.20/passenger benchmark) toward expansions, reducing overall burden while meeting net-zero targets.
- Modal Integration: Dedicated active travel lanes promote cycling/walking links to buses, further boosting load factors through multi-modal trips.
Overall, the SLC positions Translink for ~30–60% efficiency gains in the region, with higher load factors via densified ridership and network resilience.
